![]()
![]()
**************************************************************************************
Market AstroPhysics of A Down Day
Chaos Clinic for 1/06/2023
***************************************************************************************
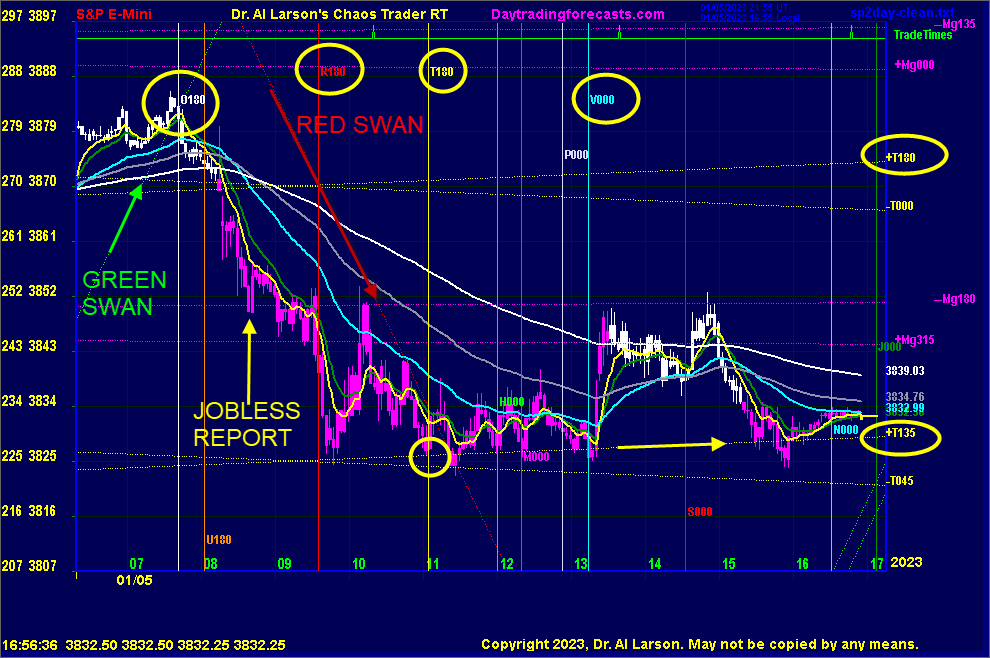
Early market news today, January 5th, 2023 said the US Market was down because of the Jobless Claims report.
One should not believe everything they hear. This chart shows the astro influences on the S&P futures today.
Shown on this chart are Moon and Mercury electric field flux lines. The Moon ones are in yellow.
The Mercury ones are in magenta. Also shown are GREEN SWAN and REd SWAN flux lines at documented on
daytraingforecasts.com.
Vertical lines mark the times when the earth rotates the NYSE to align with each planet. An aspect of
0 means the planet is overhead the exchange, 180 means it is opposite.
The 3 minute price bars are color coded by 36/220 minute EXMA crossings. The rainbow of EXMAs are the
440, 220, 110, 36, and 20 minute set used on daytradingforecasts.com. Times on the horizontal axis are Eastern time.
The market peaked on the Node O180 time line, nearly an hour before the jobless report. As prices dropped below the
pair of Moon flux lines, they were colored magenta, down. Right near the breakdown time, the up Green Swan
crossed the down Red Swan.
Right at the Jobless claims report, prices found temporary support on the Mercury flux lines. Then just
after the normal session open, the Mars R180 time line fueled further decline, to the pair of Moon flux lines.
Near 11:00 the exchange opposed the Moon on the T180 timeline. About 20 minutes later the Red Swan lost
effect, and prices were held up by the Moon +T135 flux line. Here prices built a base, but seemed helpless to rally.
The exchange rotating under Venus changed that. Prices jumped sharply up to the Mercury flux and the 440 minute EXMA.
The rally stalled there, sagging back to the Moon T135 electric field flux line.
For more on my work and to subscribe to Tomorrow's Market Email Hotline and access to daytradingforecasts.com see
Moneytide.com
Software to plot electric field flux lines in NinjaTrader is available at
energyfieldtrading.com
1/6/2023 10:51:31 AM MT Al****:: I'm going to call it a day for the clinic
thanks for coming
see you next week
take some courses
1/6/2023 10:37:08 AM MT Al****:: I think there will be some hedge fund selling for a reversion to the mean here
little guys could buys some SH EFTs if you want
1/6/2023 10:11:21 AM MT Al****:: peaking at solar noon
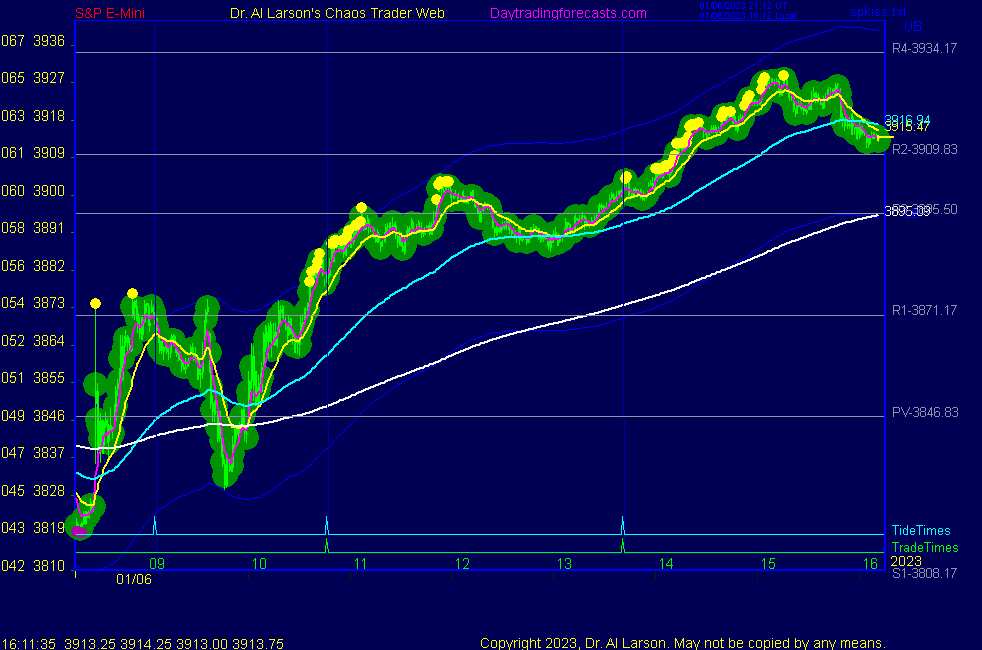
1/6/2023 9:31:23 AM MT Al****:: chart 6 on SPKISS page puts the last two weeks in perspective
1/6/2023 9:23:25 AM MT Al****:: see charts 3 and 5 on the SPKISS page - 3 shows we have hit the R3 pit price
1/6/2023 9:21:00 AM MT Al****:: the last two week have been a flat congestion, with multiple tops in this area
1/6/2023 8:27:02 AM MT Al****:: today is Full Moon, so have Moon and Sun time lines near
12:00, joined by Mercury
1/6/2023 8:24:00 AM MT Al****:: employment report set up large swings so MoonTide times may not be that good
last low found support on the Moon +T135 flux line that was support yesterday
1/6/2023 7:54:50 AM MT Al****:: Good Morning visitors. Welcome to the Chaos Clinic.
The written Chaos Clinic is on the AUX page.
This site has a lot of charts,
so you may find it useful to have several of them available within your
browser. If you have a tabbed browser, you can open separate charts
in separate tabs by right clicking on any link, and selecting "open in new tab"
from the menu. The main list of site pages is at
http://daytradingforecasts.com/chartlistsec.asp
Recommended pages to watch are SPKISS, MTRainbow, and Chat.
For astro stuff, add SPSunMoon, Wheel, and Chaos Clinic.
A special set of Dr. Al's research charts are on the Secret page.
Comments in the chat room are announced by a
"duck call" noise. This noise also occurs when the software detects a
resonant hex pattern on the Wheel page. MoonTide trading tutorials
are on the right side of the ListOfCharts page. One should
read Trading the MoonTide Tutorial and Keep it Simple as a minimum.
Many subscribers do not strictly trade the MoonTides, but use the charts on this
site as input to their own trading strategies. For example, charts 5 and 6 on the
SPKiss page are a good starting point for swing traders.
Also on this site is the Certified Chaos Trader's Room. That room is open
to graduates of my 4 main courses. See http://moneytide.com -> Courses for details.
9:00 Eastern-System: No comments
![]()
![]()