Chaos Clinic Recap

Here are Al's comments
3:05 I'm done for the day. Thanks for coming. See you next week. Take a course
3:02 does not look like we get a late drop; cancelling stop and passing on third trade
3:00 on Tuesday, the Moon will have moved 45 degrees, forming a "Two Moon day"-often volatile and one way
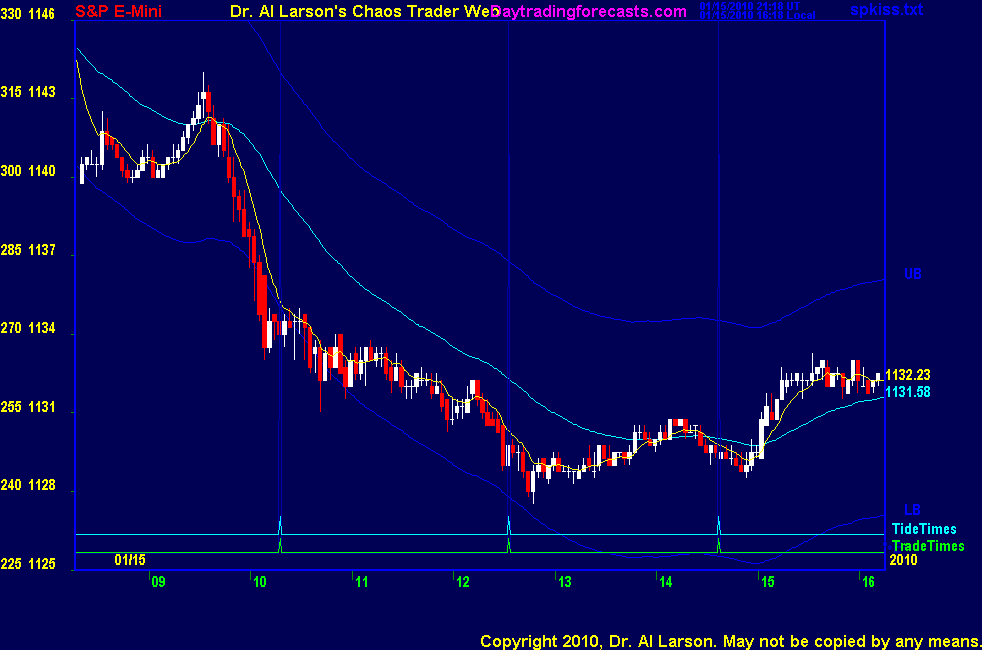
2:54 Sell stop is at 1126.50, 1 point under low; if hit buy stop goes at 1131.5 , just above the Moon flux
2:50 did get a 20/110 buy, then sell set of crossings-possible "hook and go"
2:47 OK, the "We must go to the park every day" square is filled; not much happened
2:23 taking a break to take Scout and Scamp to the park; sell stop is in
2:13 my basis for that viewpoint is the Face Of God chart I just posted in the Certified Chaos Trader's room
2:09 looks to me like we hold up into the close without much volatility
1:59 stuck on the Sun +H315 flux
1:53 Monday is a holiday, so the volatility may dry up this afternoon
1:45 On the third trade, I don't want to be in unless we break to new lows. Putting sell stop at 1126.5
upside limited by M+000 flux at 1135 = 440 EXMA
1:41 on the SPSunMoonMer chart, support was on the Moon -T180 flux; trapped in congestion zone
between that and the +T315 flux
1:30 covered because on my MTRainbow chart the candles turned white- short term bullish
1:28 out flat
1:25 if you draw a line parallel to the 440 EXMA, along the recent highs, and another along the lows,
you can see the "Tunnel Thru The Air" that we dropped into after hitting the "Air Pocket"
1:22 stop to 31
1:19 trade needs to move soon or I'm out
1:06 trade Ok; 1122 is the Moon+270 flux, square the Moon part of the eclipse; should reach that
12:49 stop 1131.5 - at the 110 EXMA
12:47 I have posted a Fractal Grid chart ( from Chaos Trading Made Easy course) in the CCT room.
12:42 after two months of dull days, it is hard to get used to the idea that today is a break down day
12:36 if the Moon +T315 flux was the midpoint of the move, we could see 1118
12:33 on the MTRainbow chart, the averages accelerated as passed that timeline
12:29 elected short 29.25 stop 32.25; drop came after passing the Moon T+0 timeline
12:20 backing stop off to 1129.25 ; trying not to get caught in a marginal new low
12:03 sell stop not hit yet
11:58 if sell stop is hit, buy stop goes at 1135
11:54 testing low
11:41 on the MTRainbow chart, the 440 is near 1139, and the 110 is near 1134;
trend down, but corrective rally probable
11:36 rally slow to develop; weaker than I expected
11:30 looking weak; just in case, placing a sell stop at 1130, one point below Moon flux support
11:20 good example of "Chaos follows dullness" yesterday and this morning, and "Dullness follow chaos" today
11:06 a 50% retrace of today's down move is 1137.50
11:00 higher minor low
10:54 overhead, 1135 Mercury flux and 1137 Moon flux are resistance
10:49 on the MTRainbow chart, the white 440 EXMA is up at 1140.76. Expect a return toward it
10:42 streak on the Mercury timeline, down to Moon T+315 flux, then back up
10:36 on the SPSunMoonMer chart, the high was on +M045 Mecury flux, suggesting a down move until the Mercury timeline
in a price to time move
10:28 now I expect a couple hours of weak rally; hanging aroung the Mercury M000 flux as come to Mercury timeline
10:23 I have posted my Fractal Of Pi Chart in the Certified Chaos Trader's Room.
That room is open to graduates of my 4 main courses-see http://moneytide.com->Courses for details
10:17 nearing exact tide time. Watching for a low
10:10 out for +5 ; there may be more, but profits have been tough for weeks
Also, my Fractal of Pi overlay says move is about done
10:09 stop to 1137
10:06 stop to 1138
10:02 stop to 38.75, break even
10:01 looks like the eclipse changed both volatility and direction
9:58 stop 1140, trailing by 3
9:56 trend on MTRainbow is now down
9:51 elected short 38.75, putting stop at 41.75
9:48 testing the low
9:44 on the SPSunMoonMer chart, the early low was on the yellow Moon +T000 flux line, just above the green Sun flux
they are hot due to the solar eclipse a few hours ago
9:40 getting a continuation sell setup on the 20/110 EXMAs; watching for follow through; putting sell stop at 1138.75
9:38 MTRainbow chart shows congestion on the moving averages; looks flat to down
9:33 opening a bit lower; trade times 10:18, 12:33, and 14:37
9:00 Good morning from Chaos Manor
Besides the comments made by Al, the chat room is has live
comments from other traders who sometimes share their views,
trades and tips. Below are the chat room comments from this clinic
1/15/2010 6:02:23 AM MT mm****:: gm all - have a great day
9:00 Eastern-System: No comments


[ Live Clinics on Friday on DaytradingForecasts.com ]


