![]()
![]()
**************************************************************************************
Harmonics Of This Week's S&P Drop
Chaos Clinic for 1/20/2023
***************************************************************************************
After a strong early January rally, this week the S&P dropped sharply on fears of higher
interest rates.
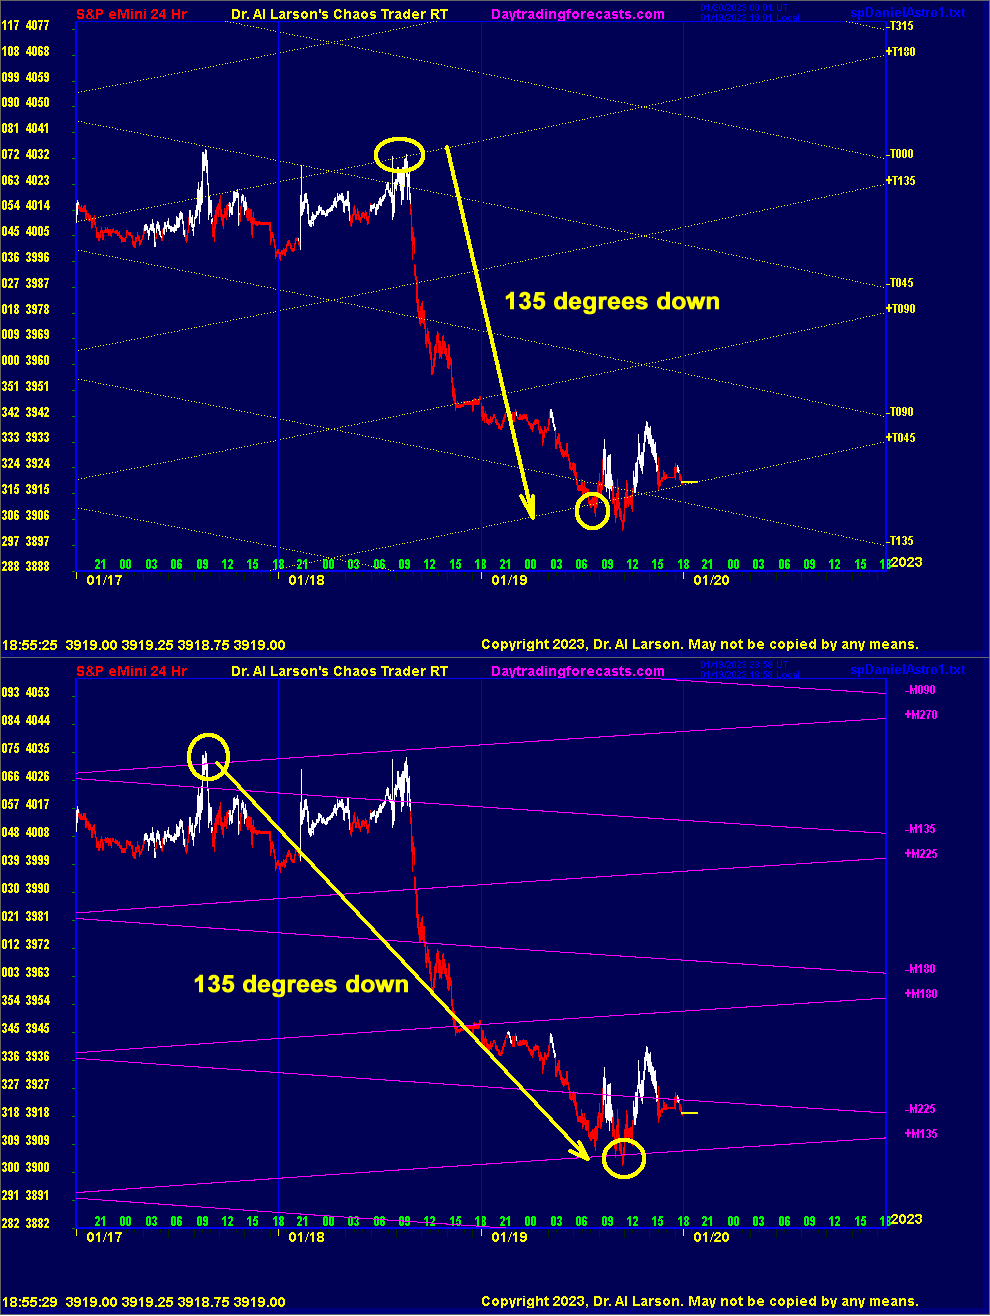
These two charts show electric field flux line harmonics of the drop. The top chart
shows the Moon flux lines. On the 18th, prices tried to rally , but met resistance at the
+T180 Moon flux line. On the close of the 18th, prices hugged the +T090 flux. Then overnight
prices declined to the Moon +T045 flux line. This is a 135 degree drop on the Moon flux lines.
The second chart shows the mercury electric field flux lines. The rally on the 17th met resistance
on the Mercury +M27 flux. The morning rally on the 18th fell short of this flux. Near the close on
the 18th, prices held on the +M180 flux. The drop found support on the 19th on the +M135 Mercury
flux.
Moves of 135 degrees are common, being 3/8 of a circle. Note that 3 and 8 are part of the Fibonacci
sequence, which runs 1, 2, 3, 5, 8, etc. So even in chaotic moves, there is harmony.
For more on my work and to subscribe to Tomorrow's Market Email Hotline and access to daytradingforecasts.com see
Moneytide.com
Software to plot electric field flux lines in NinjaTrader is available at
energyfieldtrading.com
1/20/2023 1:36:29 PM MT Nel****:: guess Al's was 3981 was a good cover price
1/20/2023 1:17:50 PM MT Nel****:: broke right through it - next level up on esnat360 is 4035 !!
1/20/2023 1:13:07 PM MT Nel****:: there's Al's 3981
1/20/2023 11:52:39 AM MT Nel****:: I think Al quit so he could buy this :)
1/20/2023 11:27:24 AM MT Al****:: I'm calling it a day for the Clinic - one good trade is enough for me on a Friday-see you next week-take some courses
1/20/2023 11:20:40 AM MT Al****:: or not -3940 taken out
1/20/2023 11:19:18 AM MT Al****:: the quick bounce off the 220 is positive for longs
1/20/2023 11:13:25 AM MT Al****:: dipping to the 220 - some traders are eating their marshmallows
1/20/2023 11:05:27 AM MT Al****:: a handy crutch is to watch the 36/220 EXMA pair - several charts color the bars white for long or magenta/red for short
1/20/2023 10:51:36 AM MT Al****:: if you look at the Chaos Clinic chart you see the possibility of a late red -Tide rally , so waiting while holding a profitable trade makes sense
1/20/2023 10:44:58 AM MT Al****:: that's not a hard choice if one got long near the pivot, say 2925.
A stop at 3940 locks in a profit, making it easier to wait for prices to hit R2.
1/20/2023 10:39:13 AM MT Al****:: those who bought the pivot and are now watching trade running along R1 are now faced with what is known in behavioral psychology as the "Marshmallow Test." Resist eating one now and get two later
or eat one now.
1/20/2023 10:21:19 AM MT Al****:: these EXMAs can help you manage MoonTide trades - if one navigated the normal session opening chop and bought on the first trade time, a carry through on the second Tide time would be warranted
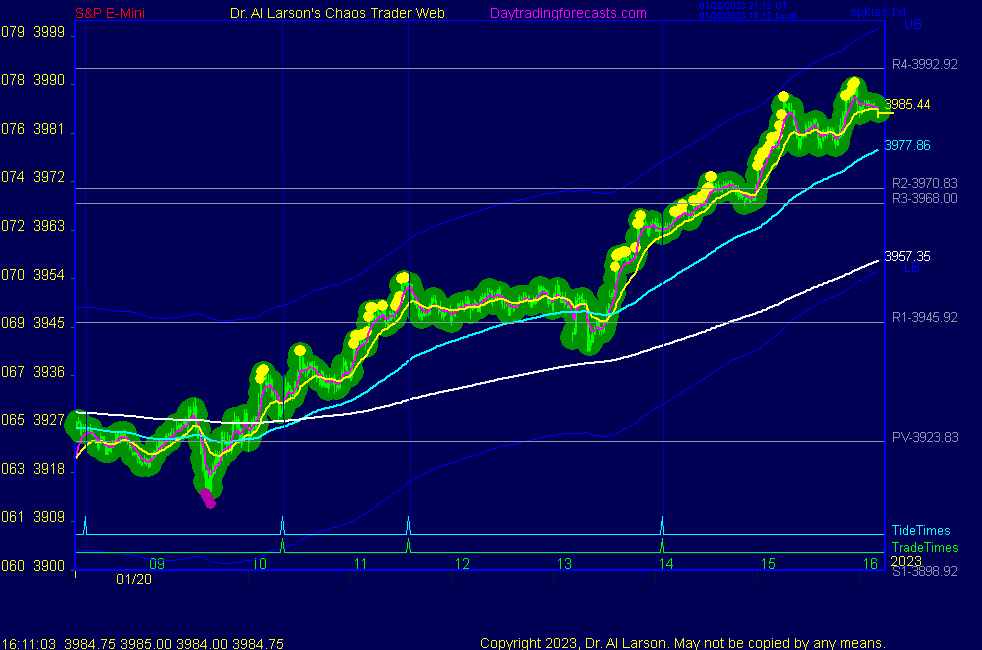
1/20/2023 10:08:06 AM MT Al****:: you see that on chart 3 on the SPKISS page
1/20/2023 10:03:48 AM MT Al****:: one can judge the strength of a move by noting which EXMAs support the dips-today the 110 minute EXMA has not been touched so this is a fairly strong move
1/20/2023 9:48:38 AM MT Al****:: now coming to the Sun and Pluto time lines at 12:00 Eastern- may add energy
1/20/2023 9:35:21 AM MT Al****:: secret->esnat360 green vibration level is near 3981
1/20/2023 9:27:21 AM MT Al****:: R2 is viable target
1/20/2023 9:26:15 AM MT Al****:: chart 4 on SPKISS page shows the move from pivot to R1
1/20/2023 9:09:48 AM MT Al****:: Moon time line added energy
1/20/2023 8:30:37 AM MT Al****:: now getting energy from the Mercury time line
1/20/2023 8:25:14 AM MT Al****:: note on secret->esnat72 chart double bottom on magenta vibration level-normally means price will reach the next magenta level up
1/20/2023 7:51:59 AM MT Al****:: opening minutes of normal session is often choppy-tested overnight low
1/20/2023 7:12:23 AM MT Al****:: the Mercury and Moon time lines between 10:00 and 11:00 may add energy
Flash Boy look to have bought the pivot
1/20/2023 6:48:06 AM MT Al****:: Good Morning visitors. Welcome to the Chaos Clinic.
The written Chaos Clinic is on the AUX page.
This site has a lot of charts,
so you may find it useful to have several of them available within your
browser. If you have a tabbed browser, you can open separate charts
in separate tabs by right clicking on any link, and selecting "open in new tab"
from the menu. The main list of site pages is at
http://daytradingforecasts.com/chartlistsec.asp
Recommended pages to watch are SPKISS, MTRainbow, and Chat.
For astro stuff, add SPSunMoon, Wheel, and Chaos Clinic.
A special set of Dr. Al's research charts are on the Secret page.
Comments in the chat room are announced by a
"duck call" noise. This noise also occurs when the software detects a
resonant hex pattern on the Wheel page. MoonTide trading tutorials
are on the right side of the ListOfCharts page. One should
read Trading the MoonTide Tutorial and Keep it Simple as a minimum.
Many subscribers do not strictly trade the MoonTides, but use the charts on this
site as input to their own trading strategies. For example, charts 5 and 6 on the
SPKiss page are a good starting point for swing traders.
Also on this site is the Certified Chaos Trader's Room. That room is open
to graduates of my 4 main courses. See http://moneytide.com -> Courses for details.
9:00 Eastern-System: No comments
![]()
![]()