![]()
![]()
********************************************************************************
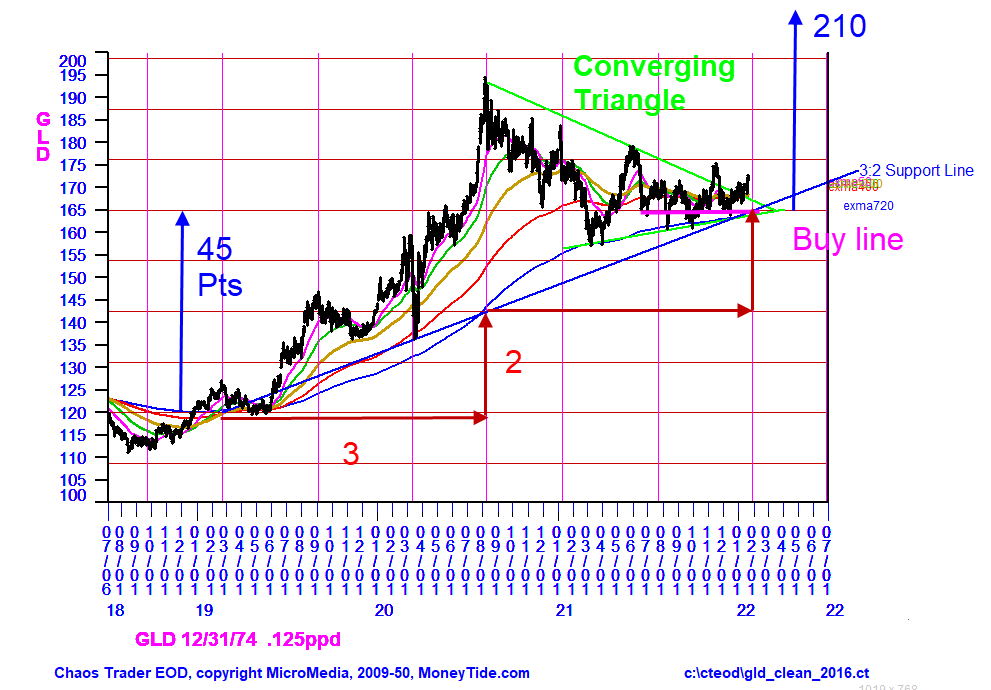
Gold Lifts Off
Chaos Clinic for 1/21/2022
********************************************************************************
This chart of the GLD Exchange Trade Fund is an update to the 10/8/2020 and
11/5/2020 Chaos Clinics.
Those clinics showed the converging triangle in GLD, basing on the price of 165.
That converging triangle is now ending.
This chart contains a natural time and price energy grid for GLD, which identifies
key times and price levels at which GLD will vibrate. Also shown on the chart
is a rainbow of EXMAs of 50, 100, 200, 400, and 720 days.
During the converging triangle the lows have kept bouncing off the 720 day EXMA,
while the others have twisted together above it. These EXMAs are now starting to
diverge, as GLD rises.
Energetically, prices have held above a 3:2 time-price line. This line serves as
a supporting trend line. This vibration grid also suggests that the coming rally
will likely move up another 3 levels, which would make for a target of 210.
The 3:2 ratio is right out of the musical scale, known as "the fifth." So
gold is singing.
For more on my work and to subscribe to Tomorrow's Market Email Hotline and access to daytradingforecasts.com see
Moneytide.com
Software to plot electric field flux lines in NinjaTrader is available at
energyfieldtrading.com
1/21/2022 12:05:51 PM MT BNW:: Thank you!
1/21/2022 11:58:59 AM MT jvj****:: BNW: Times are Eastern time as noted on the hotline forecast page.
You will find it below the charts in the text portion below the charts.
1/21/2022 11:44:05 AM MT BNW:: New here - just to be 100% clear - are times referenced on charts/trades etc. your local mountain time or the exchange central time?
1/21/2022 11:10:34 AM MT RAF:: Thank you Al, have a good weekend:)
1/21/2022 11:01:13 AM MT Al****:: great day for just watching - going to call it a day-thanks for coming-see you next week-take some courses
watch for possible late rally after those vertical lines on the secret charts
1/21/2022 10:26:38 AM MT Al****:: FWIW: posted a Fractal of Pi chart in the CCTRoom
1/21/2022 9:43:07 AM MT Al****:: on the Secret ->esnat72 chart the low at 4413 on the yellow vibration is down 4 45 degree levels = 180 degrees from the
yellow level of yesterday's high
1/21/2022 8:13:17 AM MT Robert****:: 4419 level next
1/21/2022 7:25:41 AM MT Al****:: 15 was just a rough number
1/21/2022 7:11:36 AM MT DWY:: albie, how are you computing that the moon moves~15 degrees per day? i am getting ~13 deg per day. thanks
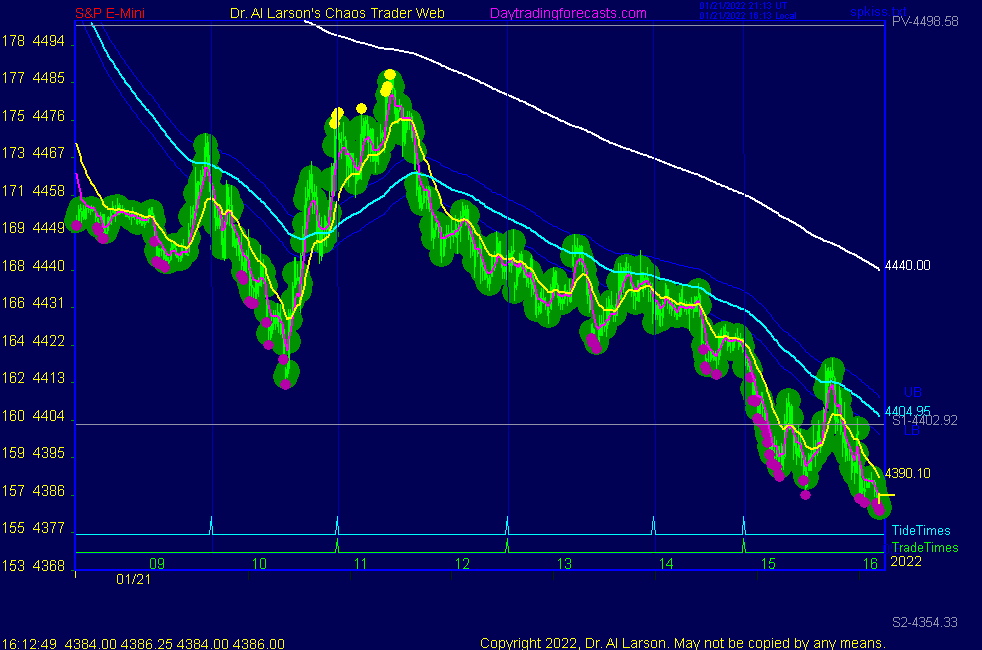
1/21/2022 6:56:11 AM MT Al****:: On the SPKISS page Chart 3 shows yesterday's big afternoon drop
Chart 5 shows it may have been move 7 in a down Chaos Clamshell
Behavioral psychology studies show that after a big gain or a big loss traders tend to take more risk, and loose money
Even worse, if you missed the trade, you are even more likely
to take more risk and loose money.
So the point today is to be cautious.
My research shows big moves come from a combination of cycles - the meat of yesterday's drop came as the Moon opposed Jupiter in the afternoon. The Moon moves about 15 degrees per day, so that lunar cycle is gone
1/21/2022 6:37:50 AM MT Al****:: Good Morning visitors. Welcome to the Chaos Clinic.
The written Chaos Clinic is on the AUX page.
This site has a lot of charts,
so you may find it useful to have several of them available within your
browser. If you have a tabbed browser, you can open separate charts
in separate tabs by right clicking on any link, and selecting "open in new tab"
from the menu. The main list of site pages is at
http://daytradingforecasts.com/chartlistsec.asp
Recommended pages to watch are SPKISS, MTRainbow, and Chat.
For astro stuff, add SPSunMoon, Wheel, and Chaos Clinic.
A special set of Dr. Al's research charts are on the Secret page.
Comments in the chat room are announced by a
"duck call" noise. This noise also occurs when the software detects a
resonant hex pattern on the Wheel page. MoonTide trading tutorials
are on the right side of the ListOfCharts page. One should
read Trading the MoonTide Tutorial and Keep it Simple as a minimum.
Many subscribers do not strictly trade the MoonTides, but use the charts on this
site as input to their own trading strategies. For example, charts 5 and 6 on the
SPKiss page are a good starting point for swing traders.
Also on this site is the Certified Chaos Trader's Room. That room is open
to graduates of my 4 main courses. See http://moneytide.com -> Courses for details.
9:00 Eastern-System: No comments
![]()
![]()