![]()
![]()
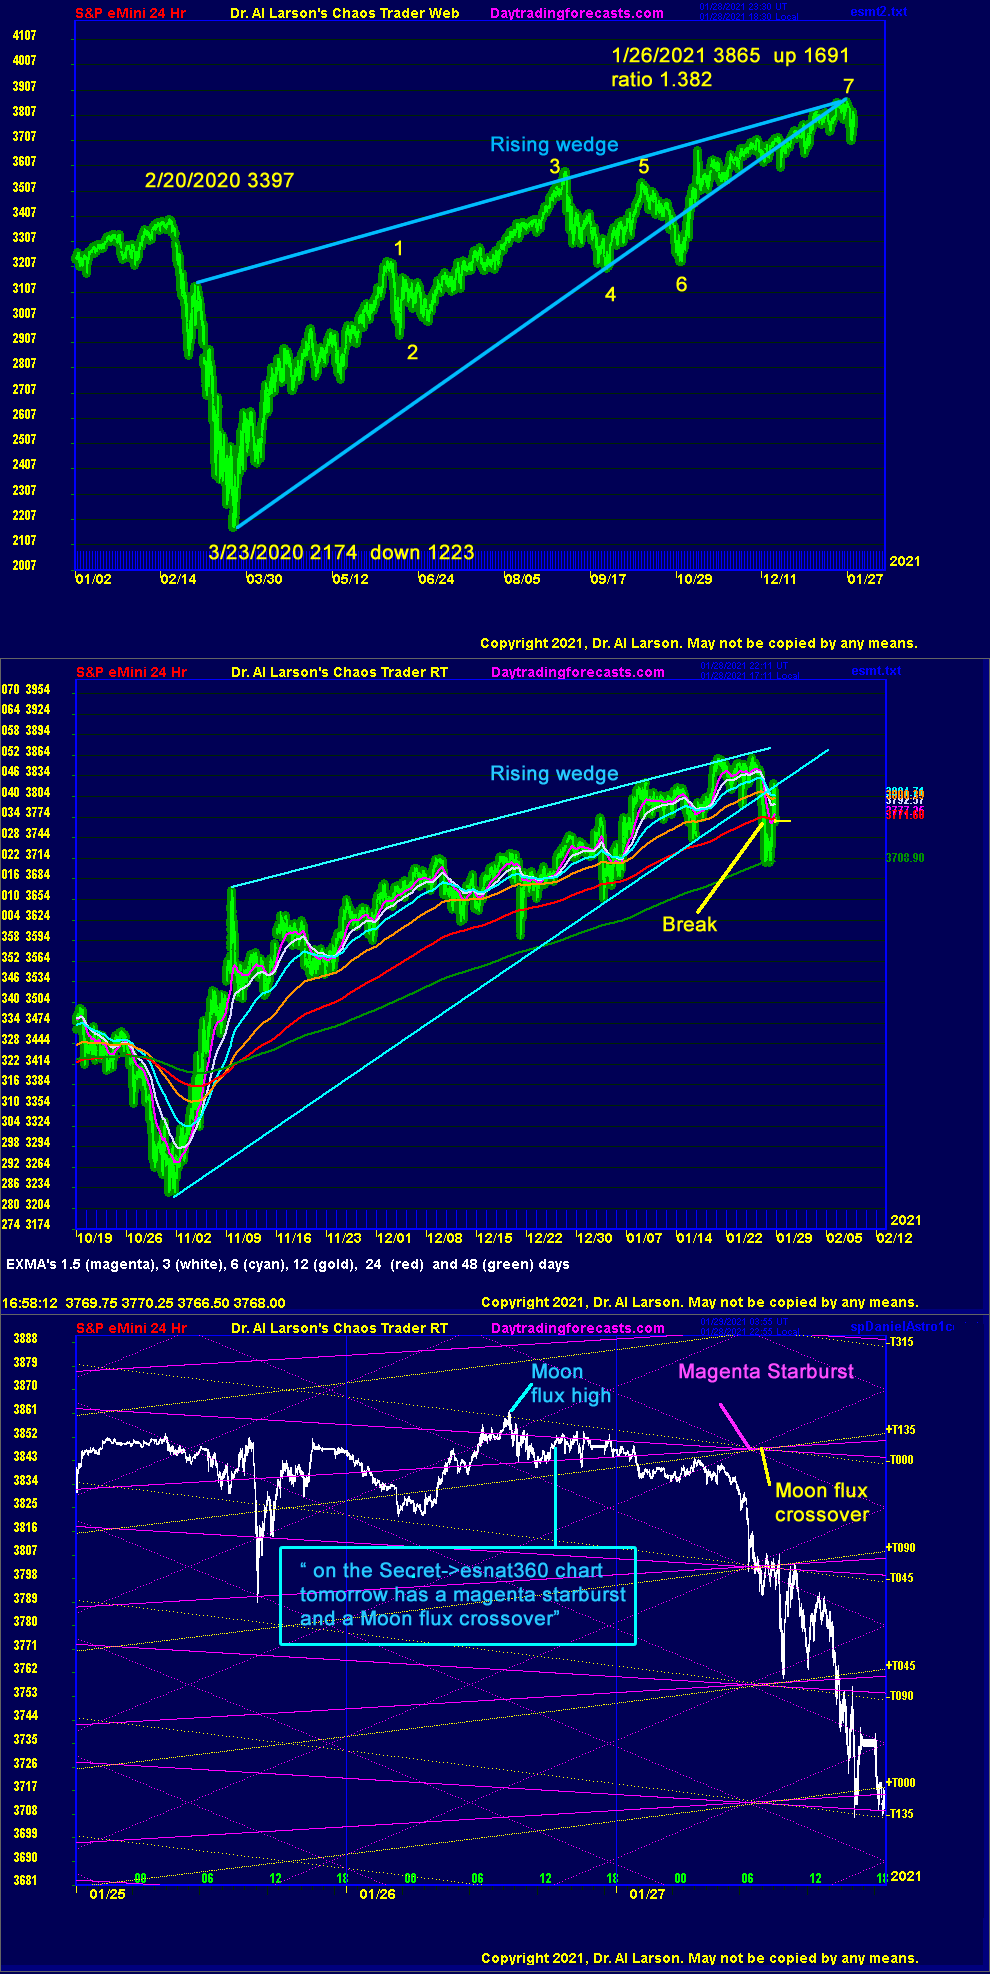
These three charts show that the S&P may be on the brink of a serious pullback.
The top chart shows the S&P during the time of the Covid-19 epidemic in America.
From the February 2019 high, the S&P dropped sharply, 1223 points in 31 days.
Since then it has rallied 1691 points in 309 days. This is a 1.382 Fibonacci
retracement. Since many traders use Fibonacci ratios, this is a point to watch
for the start of a possible pullback. The pattern is a rising wedge. A possible
7 move Chaos Clamshell is numbered.
The second chart shows the price action since late October. It plots an EXMA rainbow,
with periods of 1.5, 3, 6, 12, 24, and 48 trading days.
After a sharp drop in late October, prices shot up sharply, turning all of the EXMAs up sharply.
From then until this week, the EXMAs show an upward flow, with only two brief dips
below the red 24 day EXMA. The 12 day EXMA shows steady up. Up until this week.
The Rising Wedge support line hits 3 lows in January. This week the last low bounced up sharply
on Monday. On Tuesday, The market made a marginal high, then sagged all day. On Wednesday,
prices broke sharply, all the way down to the 48 day EXMA. Then on Thursday prices
bounced up to give the supporting trend line a "Good Bye Kiss." It looks like the EXMAs are
rolling over.
The third chart shows a version of the Secret->esDaniel chart on the http://daytradingforecasts.com site.
After the unproductive spike low on Monday, I was looking at my detailed Daniel chart.
Early Tuesday I noticed that prices had been turned down by a down Moon flux (yellow). The up Moon flux
worked to trap prices in a horizontal converging Moon flux triangle. Then I noticed that inside that
triangle was another magenta pair of a converging triangle. That magenta pair was part
of a Magenta Starburst pattern coming up on early the next day. This is a known indicator of possible
high volatility.
Here is the brief discussion from the daytradingforecasts.com chat room on Tuesday:
1/26/2021 12:08:24 PM MT qq:: RSP equal weight down big to SPY since 1/19. Possible big correction ahead?
1/26/2021 12:23:35 PM MT Al****:: could be-spike bounce yesterday looks to me like "bounce it up to distribute"
1/26/2021 1:27:16 PM MT qq:: Thanks Al
1/26/2021 1:41:39 PM MT Al****:: on the Secret->esnat360 chart I changed the scale back to a wheel of 360
tomorrow has a magenta starburst and a Moon flux crossover
The outcome was dramatic, with the drop on Wednesday going down three 45 degree levels. The high energy
came from the synchronicity of the Magenta Starburst and the Moon flux cross over.
This was a trigger event, which may lead to further decline. Watch the rainbow of EXMAs on the second
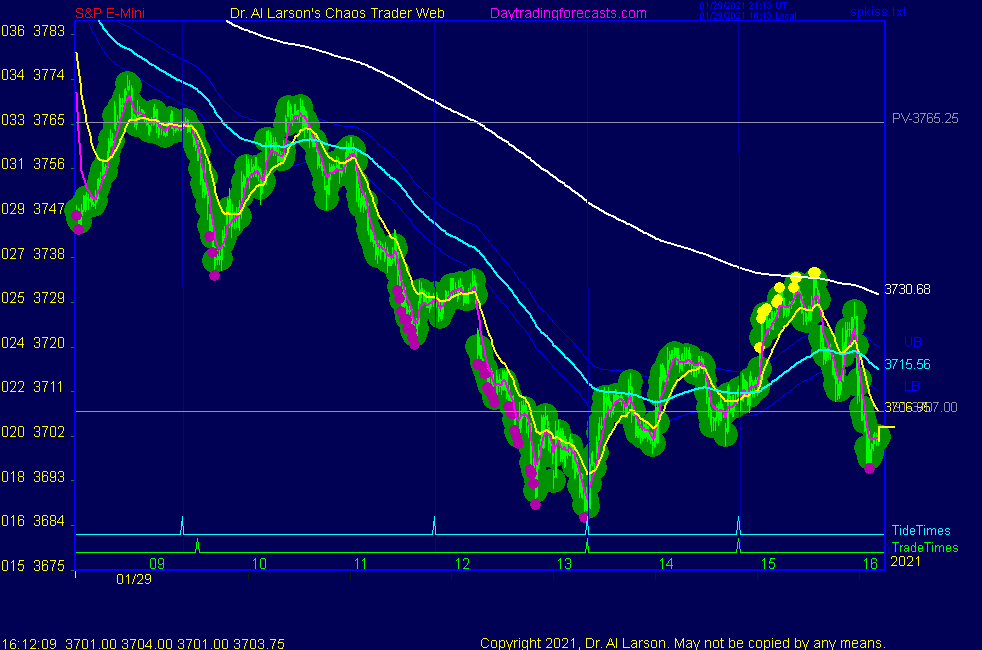
chart for confirmations. A version to it is on the SPKISS page at daytradingforecasts.com.
For more on my work and to subscribe to Tomorrows Market Email Hotline and access to daytradingforecasts.com see
Moneytide.com
Software to plot electric field fluxlines in NinjaTrader is available at
EnergyFieldTrading.com
1/29/2021 1:32:14 PM MT pab:: looks like Fed back in the driver's seat
1/29/2021 11:50:26 AM MT Al****:: I'm done with the Clinic. Hope you learned something. You can thanks me by taking some courses and/or subscribing to the hotline.
Have a good weekend
1/29/2021 11:47:01 AM MT Al****:: stopped for +34.75
1/29/2021 11:30:43 AM MT Al****:: stop to 3714
1/29/2021 11:06:25 AM MT slc:: I think the main thrust is down is over. Its the last hour of the day that there could be renewed selling
1/29/2021 11:04:05 AM MT Al****:: stop 3624
1/29/2021 11:02:04 AM MT Al****:: EXMAs have a property that turns them into straight lines
the 110 is now in this condition -drawing an extension of it to the close gets close to 3650
1/29/2021 10:53:59 AM MT pab:: abc down completed---? another turn up to be attempted?
1/29/2021 10:34:31 AM MT Al****:: put my cover limit at 3650
1/29/2021 10:33:53 AM MT Al****:: the high volatility spread out the pivot numbers S2/S3 are clear down near 3649/45
1/29/2021 10:28:21 AM MT Al****:: can't fight the EXMA flow :)
1/29/2021 10:24:32 AM MT qq:: My timing was terrible. Oh well made more than enough earlier to easily cover loses.
1/29/2021 10:23:05 AM MT Al****:: lowered stop to 3736 - just above the 110 minute EXMA
1/29/2021 10:19:39 AM MT Al****:: I watch 8 hour bars on SH -it is moving up
1/29/2021 10:18:36 AM MT Al****:: lowered cover to 3680
1/29/2021 10:16:04 AM MT Al****:: the EXMA flow is down
1/29/2021 10:11:44 AM MT Al****:: lowered stop to 3741 - above the 110 minute EXMA
1/29/2021 10:04:28 AM MT qq:: Bought some SPY calls moments ago.
1/29/2021 10:04:15 AM MT Al****:: S1 is at 3707 so put a buy limit order there
1/29/2021 10:01:23 AM MT Al****:: put a buy stop at 3746 -lock a bit for a free trade
1/29/2021 9:53:40 AM MT Al****:: on esnat72 down 1 green vibration level - may go 2
1/29/2021 9:39:32 AM MT Al****:: that chart is the same as the 3rd chart on the SPKISS page with additional indicators from the CTME course
1/29/2021 9:33:43 AM MT Al****:: I acted based on a Chaos Trading Made Easy chart running live in the CCTRoom
1/29/2021 9:26:35 AM MT Al****:: longer term traders can use the SH short S&P Exchange Traded Fund
I've been poinint this out all week
1/29/2021 9:24:25 AM MT Al****:: I did sell 3748.75
1/29/2021 9:24:16 AM MT ska:: It did follow What is already known out there Ok Not out there But to few ??DR AL has written so much about future of futures in the last few decades I am just following some of them It is amazing
I did not use any technical analysis to predict today`s ` move
1/29/2021 9:20:21 AM MT Al****:: today was also an example of the
"gap down-sell a high near 11:00" tendency
1/29/2021 9:16:16 AM MT Al****:: I also saw on esnat72 7 moves up from the early AM low
1/29/2021 9:14:55 AM MT Al****:: Go was good to me-I saw nothing, so took the dog to the park-when I came back I saw the setup and that the Flash Boys sold the pivot
1/29/2021 9:12:30 AM MT Al****:: note on Secret->esnat72 that it came on the vertical dark red line
1/29/2021 9:11:10 AM MT Al****:: the 3rd chart on the SPKISS page shows a "hook and go" 20/110 sell on first trade
1/29/2021 8:53:38 AM MT qq:: LOL Al. You're right about God giving us only hints
1/29/2021 8:52:50 AM MT qq:: Sold my last 2 puts at 4X profit.
1/29/2021 8:37:35 AM MT Al****:: today is last day of month so may only see chop
1/29/2021 8:34:54 AM MT Al****:: LOL guys - God only gives you hints and I often miss them or misread them, so if I get one right I give thanks
1/29/2021 8:32:15 AM MT qq:: Will the flux lines on Daniel chart near yesterdays close prove resistance?
1/29/2021 8:26:25 AM MT qq:: ska: Right that some people and certainly always for God knowing the future. As for me I tell God what I'm going to do and He laughs, knowing what I don't know.
1/29/2021 8:22:13 AM MT qq:: With 3X profit I can get a better alarm clock.
1/29/2021 8:13:44 AM MT qq:: Got up late (bad alarm clock) and missed the low, but sold 6 of my 8 puts - 4 at 8:47 and 2 at 8:58 (CST). Holding on to the 2 remaining for another dip I feel coming.
1/29/2021 8:05:32 AM MT ska:: What Dr AL is trying to prove here is that Future is known to some people or God And future is predictable ..I agree with him 100 % The future is known and predictable . Let me give u a hint today It should go down more now below the low already made ...Lert us see What happens
1/29/2021 7:37:19 AM MT Al****:: today I'm running a version of the last chart in the Chaos Clinic write up in the CCT Room
1/29/2021 6:48:48 AM MT Al****:: Good Morning visitors. Welcome to the Chaos Clinic.
The written Chaos Clinic is on the AUX page.
This site has a lot of charts,
so you may find it useful to have several of them available within your
browser. If you have a tabbed browser, you can open separate charts
in separate tabs by right clicking on any link, and selecting "open in new tab"
from the menu. The main list of site pages is at
http://daytradingforecasts.com/chartlistsec.asp
Recommended pages to watch are SPKISS, MTRainbow, and Chat.
For astro stuff, add SPSunMoon, Wheel, and Chaos Clinic.
A special set of Dr. Al's research charts are on the Secret page.
Comments in the chat room are announced by a
"duck call" noise. This noise also occurs when the sofware detects a
resonant hex pattern on the Wheel page. MoonTide trading tutorials
are on the right side of the ListOfCharts page. One should
read Trading the MoonTide Tutorial and Keep it Simple as a minimum.
Many subcribers do not strictly trade the MoonTides, but use the charts on this
site as input to their own trading strategies. For example, the bottom chart on the
SPKiss page is good starting point for swing traders.
Also on this site is the Certified Chaos Trader's Room. That room is open
to graduates of my 4 main courses. See http://moneytide.com -> Courses for details.
9:00 Eastern-System: No comments
![]()
![]()