![]()
![]()
********************************************************************************
Inflation Fears Hit the S&P
Chaos Clinic for 2/10/2022
********************************************************************************
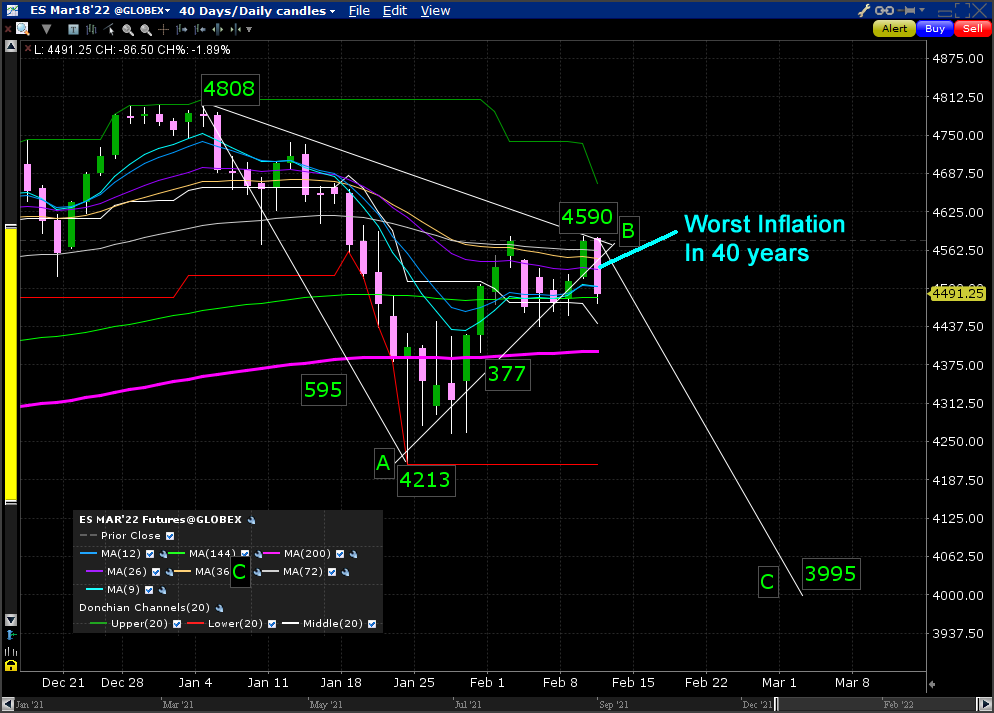
This is a daily chart of the S&P futures. It shows the sharp January decline
and the rebound into 2/9. That rebound ended with the 2/10 bearish engulfing candle,
triggered by the Consumer Price Index showing a 7.5% inflation rate, the highest
in 40 years. That down candle is the largest on the chart.
The price pattern can be bounded by a triangle as shown. If one looks at this as a
simple AB pattern, a C decline can be projected. With A equal to 595 points, an
C move to 3995 can be projected. That seems extreme, but it is possible.
The retracement from A to B is .633, close to a normal .618. So this is a normal
decline and retrace pattern. It could also be a move 1 and 2 of a larger down
Chaos Clamshell. If such a larger pattern develops, the rainbow of EXMAs will
diverge. During the rally, the green 144 day EXMA flattened. Watch for it to
turn down. Note how the 20 day Donchian channel is dropping lower.
For more on my work and to subscribe to Tomorrow's Market Email Hotline and access to daytradingforecasts.com see
Moneytide.com
Software to plot electric field flux lines in NinjaTrader is available at
energyfieldtrading.com
2/11/2022 1:44:48 PM MT NEL****:: Yes, thanks Al - big winner for me
2/11/2022 10:49:14 AM MT WTL:: Thank You Sir
2/11/2022 10:46:14 AM MT Al****:: I'm going to have to leave for a dental appointment
trend is steady down
have a good weekend - see you next week - take some courses
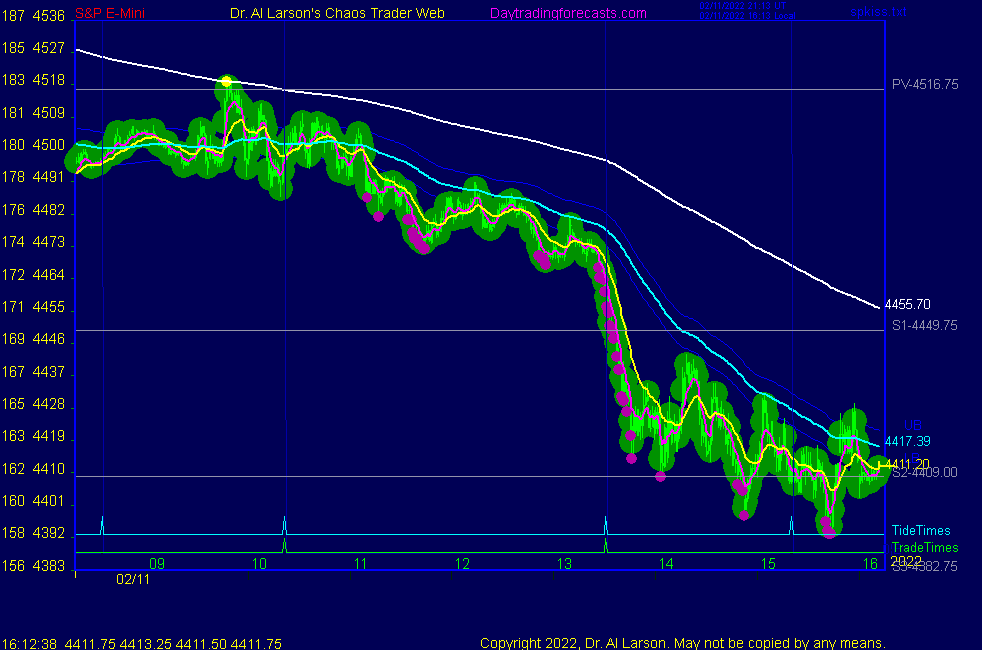
2/11/2022 9:43:09 AM MT Al****:: chart 4 on SPKISS shows the down white 440 minute EXMA with an isolated yellow push ball at the pivot
2/11/2022 9:40:35 AM MT Al****:: chart 3 on the SPKISS page showed this continuation sell
2/11/2022 9:34:13 AM MT Al****:: right now prices are at last Friday's close, making the weekly candle a doji
2/11/2022 9:31:16 AM MT Al****:: on the secret page the esNat360 page shows resistance on the yellow vibration
first MoonTide trade was a sell , but it is pretty choppy
on the Secret->esnat72 the green level is the midpoint and about
where the daily candle switches from up to down
I suspect today ends as a down candle
2/11/2022 8:53:22 AM MT RAF:: Good morning, I see yellow dotted lines forming a wedge, the Tides changing direction around the Swans intersection. Will something big (news) happen later today??
2/11/2022 8:16:11 AM MT qq:: Stopped out. Taking a long break
2/11/2022 8:09:11 AM MT Al****:: taking a breakfast break
2/11/2022 7:55:33 AM MT Al****:: hit the pivot price
2/11/2022 7:51:54 AM MT Al****:: now up to white level, which is also a 50% retrace on decline from yesterday
2/11/2022 7:50:20 AM MT qq:: Bought a few calls before the recent bounce.
2/11/2022 7:40:09 AM MT Al****:: note on the Secret->esnat72 chart the opening vibration was green
then down 2 levels to yellow, up 2 to green, down one to white, up 2 to yellow
net up 3 levels, so have 2:3 ratio right out of musical scale
2/11/2022 6:54:46 AM MT Al****:: Good Morning visitors. Welcome to the Chaos Clinic.
The written Chaos Clinic is on the AUX page.
This site has a lot of charts,
so you may find it useful to have several of them available within your
browser. If you have a tabbed browser, you can open separate charts
in separate tabs by right clicking on any link, and selecting "open in new tab"
from the menu. The main list of site pages is at
http://daytradingforecasts.com/chartlistsec.asp
Recommended pages to watch are SPKISS, MTRainbow, and Chat.
For astro stuff, add SPSunMoon, Wheel, and Chaos Clinic.
A special set of Dr. Al's research charts are on the Secret page.
Comments in the chat room are announced by a
"duck call" noise. This noise also occurs when the software detects a
resonant hex pattern on the Wheel page. MoonTide trading tutorials
are on the right side of the ListOfCharts page. One should
read Trading the MoonTide Tutorial and Keep it Simple as a minimum.
Many subscribers do not strictly trade the MoonTides, but use the charts on this
site as input to their own trading strategies. For example, charts 5 and 6 on the
SPKiss page are a good starting point for swing traders.
Also on this site is the Certified Chaos Trader's Room. That room is open
to graduates of my 4 main courses. See http://moneytide.com -> Courses for details.
9:00 Eastern-System: No comments
![]()
![]()