
1:00 I'm going to cover on the stall for +9.5 . I need to leave. May be more. Thanks for coming. Have a great weekend.
12:56 encountering mid day doldrums; holiday may dampen the rest of the day.
Overnight swing traders will be covering.
12:37 both R2 and R3 are at 1869.5, so I will cover 1869 if we get there
I also have resistance near 1863
12:28 that chart suggest holding into the close
12:26 I have placed a Fractal Grid chart in the Certified Chaos Trader's Room. That room is open
to graduates of my 4 main courses. See http://moneytide.com -> Courses for details.
eMylar Fractal of Pi overlays help you be patient, since they show you future potential moves.
The best bargain in my courses is to take the Cash In On Chaos and Fractal of Pi courses and
learn to use the FOP overlay. Then take Chaos Trading Made Easy, and finish with Face Of God.
The next Essentials of Personal and Market Astrophysics will be taught March 23-25. If you want to come, send Al An Email.
12:20 from the low, I see 1-2-3-now in 4 moves
12:13 stop to 47
12:09 looking good - just need to be patient.
11:47 stop to 46.5
11:28 letting profits run-this move could have a lot of energy; Tested low of year yesterday, got big buying.
11:26 stop to 1843 - break even
11:20 stop to 1839
11:08 looking OK ; need to break above the high to get some real juice
10:51 my plan now is to hold to the next Tide time. Will move my stop carefully
10:43 I also have another computer dedicated to showing me 9 energy analysis charts - can't look at them and trade,
but once I'm in a trade I refer to them to see what is going on in the energy fields. They say to hold.
10:35 I also use a 72 hour chart that I cant' show you. On it I have a favorable Face of God pattern.
10:23 Fridays often have an early head fake, so I'm willing to try a reverse
10:20 stopped out; bought 43.5 stop 36
10:17 the 9-10:00 candle is bearish; lots of firms watch hourly bars
10:07 may have picked up a red swan
10:05 stop is too close for conditions, backing up to 43
10:01 stop 39
9:59 continued selling sold 36 stop 40
9:53 still just observing
9:48 may be forming a low
9:40 probing lower attracted buying quickly
9:28 right now, swing traders who recognized the opportunity of buying the rally yesterday are selling part of their
position.
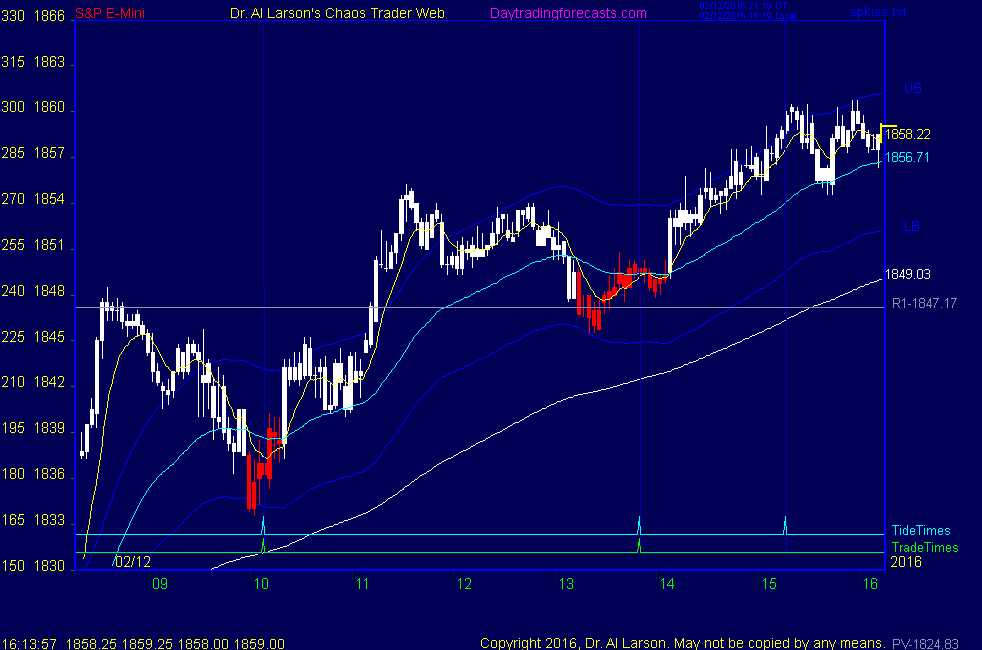
9:21 the high is 1848.5 , buying came in at 1840.5, R1 is 1847.17, so right now, in a trading range.
I will buy a break out, so putting buy stop at 1849.5
9:17 coming into the outcry session, prices are choppy
8:53 Yesterday we had a good example of the true nature of chaos. The market was heading lower in the afternoon.
It made new loses for the day. I even commented that prices looked to be heading lower. That was an OBSERVATION,
not a PREDICTION. Then out of the blue the market shot up. Someone had a big buy order parked at S2/S3 pivot price.
Timewise it was where the rotating exchange passed the Moon. So the order had additional Moon juice.
As traders we trade probabilities, but we can never believe that we know exactly what will happen.
Our tools give us an edge, but not a guarantee. Also, one needs to keep in mind that different patterns occur
on different time frames. Me saying I thought we were going lower was not a prediction of a bear market.
Bear markets develop over months, not hours. As daytraders we only worry about today. Swing traders focus on
a few days. Position traders focus on weeks or months. Investers focus on years or decades. Don't mix timeframes,
either in your analysis or in your trading.
8:45 Big up move overnight makes day trading harder; Trade times are 10:08 and 13:50;
overnight move was from pivot to R1, needs to break above R1 to continue higher
8:00 Good morning from Chaos Manor
9:00 Eastern-System: No comments
![]()
![]()