![]()
![]()
********************************************************************************
The S&P Changes Trend
Chaos Clinic for 2/25/2022
********************************************************************************
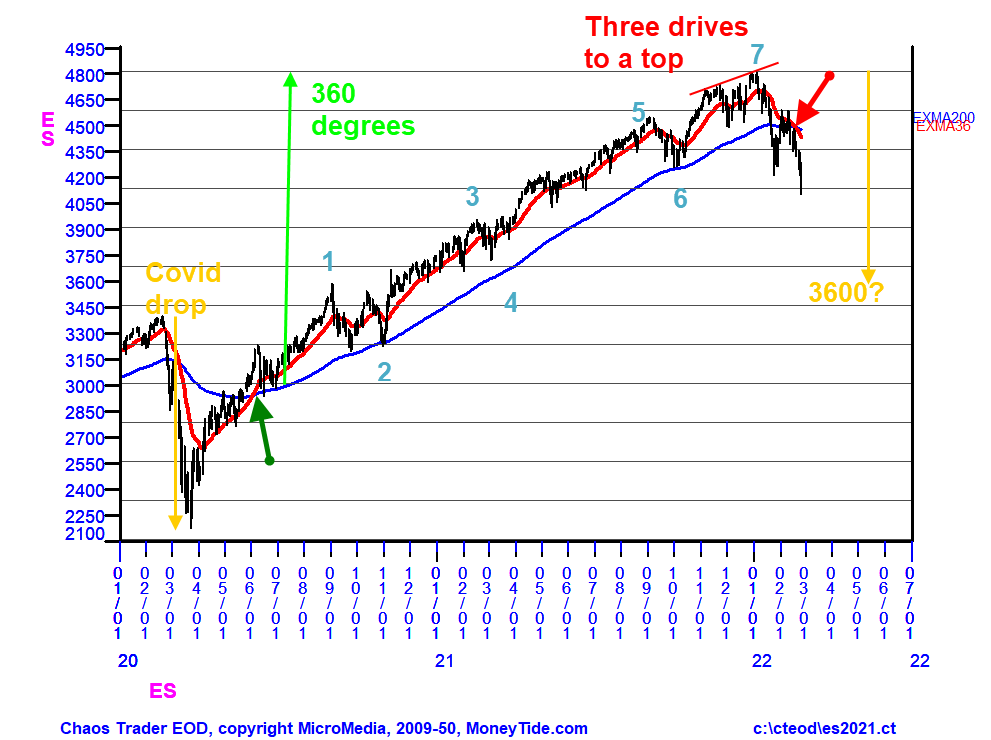
Before Russia invaded Ukraine, the S&P signaled a change in trend,
This chart is a daily chart of the S&P since the start of 2020.
The horizontal lines are natural vibration levels every 45 degrees.
The early 2020 Covid pandemic caused a sharp drop. Then, as the government injected
hugh amounts of cash into the economy, the S&P began a strong rally.
The chart shows two EXMAs, of 36 (red) and 200 (blue) days. By mid 2020, the recovery
had turned up enough to make the 36 day cross above the 200 day. This up crossover
is marked by the dark green arrow, From that point until the end of 2021, the
rally stayed above the 200 day EXMA. En route, it made an up 7 move Chaos Clamshell.
The final move 7 hit a vibrations level up 360 degrees above the up crossover level.
Then things changed sharply in 2022. Prices dropped sharply in January,
breaking below the 200 day EXMA. After a rebound into mid February, they
dropped again, enough to make the 36 day EXMA cross below the 200 day EXMA.
This is shown by the down red arrow. This signaled a change in trend.
Like COVID, the Russian invasion of Ukraine was unexpected. It seems destined to
cause higher fuel costs, adding to the inflation the FED is pledged to fight
with higher interest rates. So one might guess that the resulting decline
might be at least equal to the COVID drop. If so, a move to 3600 is possible.
For more on my work and to subscribe to Tomorrow's Market Email Hotline and access to daytradingforecasts.com see
Moneytide.com
Software to plot electric field flux lines in NinjaTrader is available at
energyfieldtrading.com
2/25/2022 9:54:38 AM MT Robert****:: Great Trade Al, I always appreciate your updates thruout the day with how your seeing your system interacting with the market.
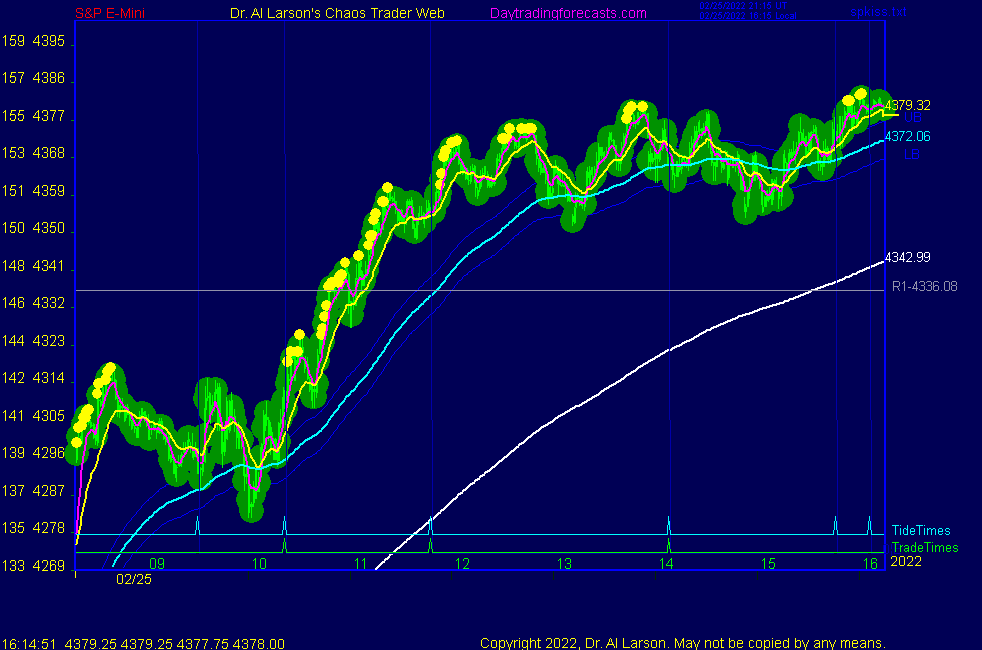
2/25/2022 9:46:22 AM MT Al****:: the first MoonTide trade time was dead on because it coincided with the Exchange rotating past Mercury
I took it for 30 points, covering when the up push balls stopped
I'm overtired from too much snow so one good trade is probably it for me
2/25/2022 9:46:20 AM MT Robert****:: Hi Al - We've had quite the move up. Do we continue from here or reverse into the next trade window?
2/25/2022 7:14:54 AM MT Al****:: Good Morning visitors. Welcome to the Chaos Clinic.
The written Chaos Clinic is on the AUX page.
This site has a lot of charts,
so you may find it useful to have several of them available within your
browser. If you have a tabbed browser, you can open separate charts
in separate tabs by right clicking on any link, and selecting "open in new tab"
from the menu. The main list of site pages is at
http://daytradingforecasts.com/chartlistsec.asp
Recommended pages to watch are SPKISS, MTRainbow, and Chat.
For astro stuff, add SPSunMoon, Wheel, and Chaos Clinic.
A special set of Dr. Al's research charts are on the Secret page.
Comments in the chat room are announced by a
"duck call" noise. This noise also occurs when the software detects a
resonant hex pattern on the Wheel page. MoonTide trading tutorials
are on the right side of the ListOfCharts page. One should
read Trading the MoonTide Tutorial and Keep it Simple as a minimum.
Many subscribers do not strictly trade the MoonTides, but use the charts on this
site as input to their own trading strategies. For example, charts 5 and 6 on the
SPKiss page are a good starting point for swing traders.
Also on this site is the Certified Chaos Trader's Room. That room is open
to graduates of my 4 main courses. See http://moneytide.com -> Courses for details.
2/25/2022 6:44:05 AM MT JRB:: hello everone
9:00 Eastern-System: No comments
![]()
![]()