![]()
![]()
********************************************************************************
What A Difference A Day Makes
Chaos Clinic for 2/26/2021
********************************************************************************
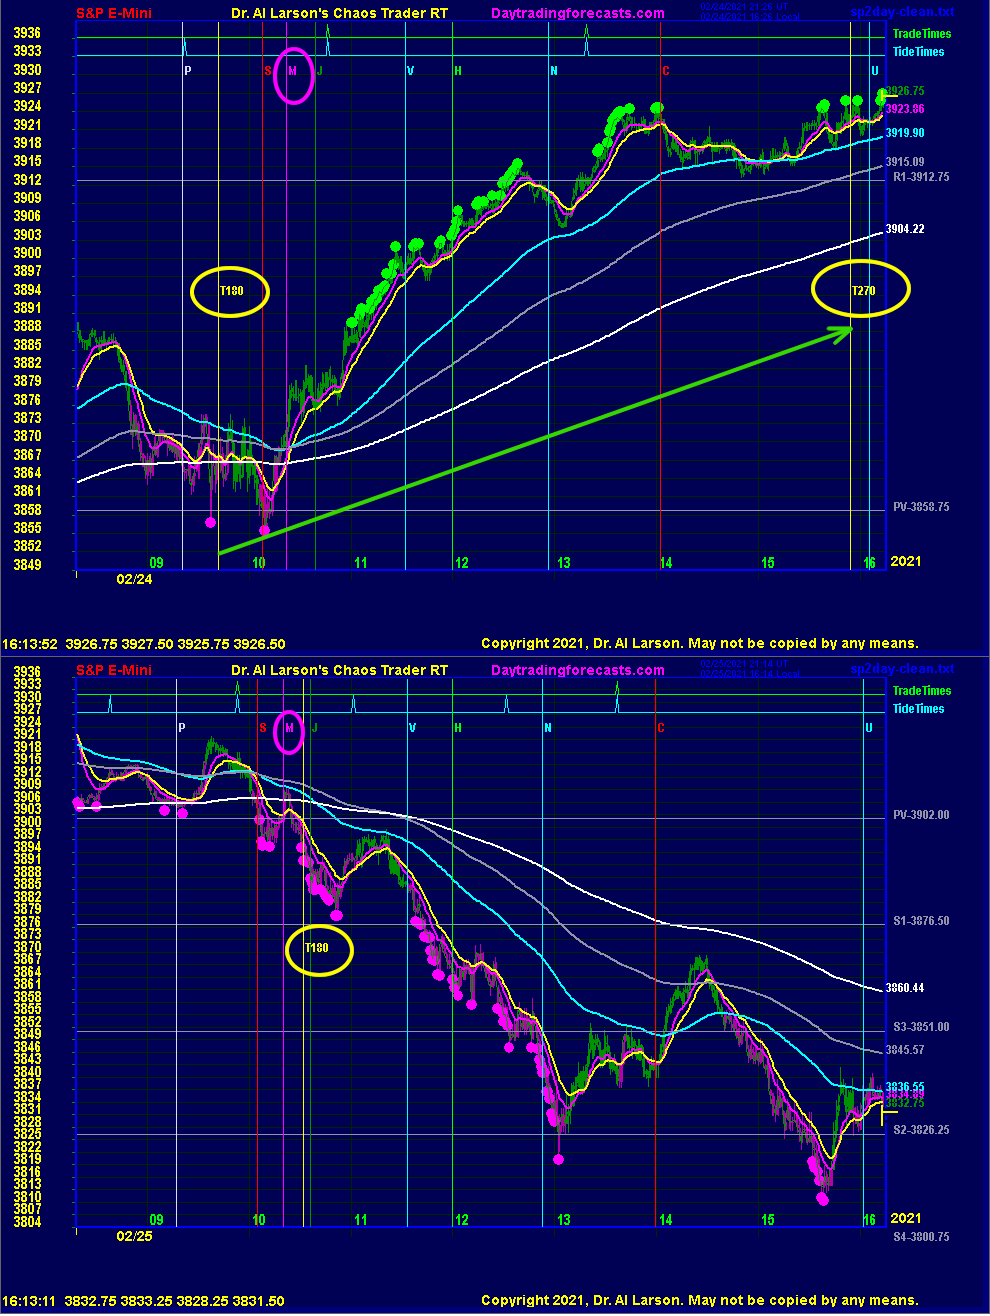
These two charts show the S&P EMini for the past two days. The charts cover the
eight hours between 8:15 AM to 2:15 PM Eastern time. The top chart is
for 2/25/2021. In the nightly hotline email the night before, I warned it was
"A two Moon day with Moon timelines near open and close. often volatile and
runs Moon to Moon or Moon, Noon, Moon." The two timelines are the two vertical yellow
lines marked T180 and T270. These times are when the rotating Earth rotates the
New York stock exchange to oppose (T180) or square (T270) the Moon.
The general tendency of running Moon to Moon was true, shown by the green arrow. But
there was much more going on. Also shown on the chart are other vertical timelines.
These are all conjunctions. Currently, there are 9 planets conjuncted by the Exchange
in the 8 hour span. In order, they are Pluto (P), Saturn (S), Mercury (M), Jupiter (J),
Venus (V),Sun (H), Neptune (N), Chiron (C), and Uranus (U). The Sun is always at 12:00
noon when on normal time. There are resonant times based on the harmonics of the 24 hour
day. The fourth harmonic of the day is 6 hours, the 6th is 4 hours, the 8th is 3 hours,
and the 12th is 2 hours. These show up in swing duration, and as offsets from the Sun.
The Moon to Moon run did not start on the Moon. The low came on the Saturn timeline almost
exactly at 10:00, two hours from solar noon. Then as the Exchange passed Mercury, prices
started up strongly, turning the EXMAs up. These are 12, 18, 110, 220, and 440 minute
EXMAs. The first MoonTide trade just after the Jupiter timeline was a clear buy.
Prices had based on the pivot price, and the move was on to R1. The move is highlighted
with a series of green "push balls." These show strong buying pressure.
The rally peaked on the Chiron timeline. This came 2 hours after the Sun timeline,
and 4 hours after the 10:00 low, all because of energy harmonics. The rest of the
day saw prices hold up into the close, and the Moon T270 and Uranus timelines.
A nice up day. The Dow even made a new record high.
What a difference on the next day, February 25, 2021. This is shown on the second chart.
The first difference one could note is that the T270 timeline has "exited stage right."
It's as if it was holding prices up, then left.
In chaotic systems, the devil is in the details. Edward Lorenz discovered that one property
of chaotic systems is that they have different behavior depending on initial conditions.
In a one body system, one can throw a ball into the air, and it will always
come back to the body, no matter how hard your throw it. But if a system with two bodies,
if you throw the ball from one body hard enough, it can be captured by the gravity of the other
body. Then, depending on the initial conditions, the ball can orbit one body, orbit both, or
crash into either. In markets, buyers and seller act as the two or more bodies, and prices
are the ball.
In a way, trading early in the normal session acts as initial conditions. So it is interesting
to note on the second chart that the Moon T180 timeline has passed the Mercury timeline,
whereas on the first chart, the Moon T180 comes before Mercury. This is a consequence of the
Moon opposing Mercury between the two sessions. The Moon-Mercury cycle is the 40 day
cycle recorded in the bible. So this tiny change in initial conditions changed the rally
into a decline. This shift in the electric field fueled the emotions of traders,
shifting them from hope to fear.
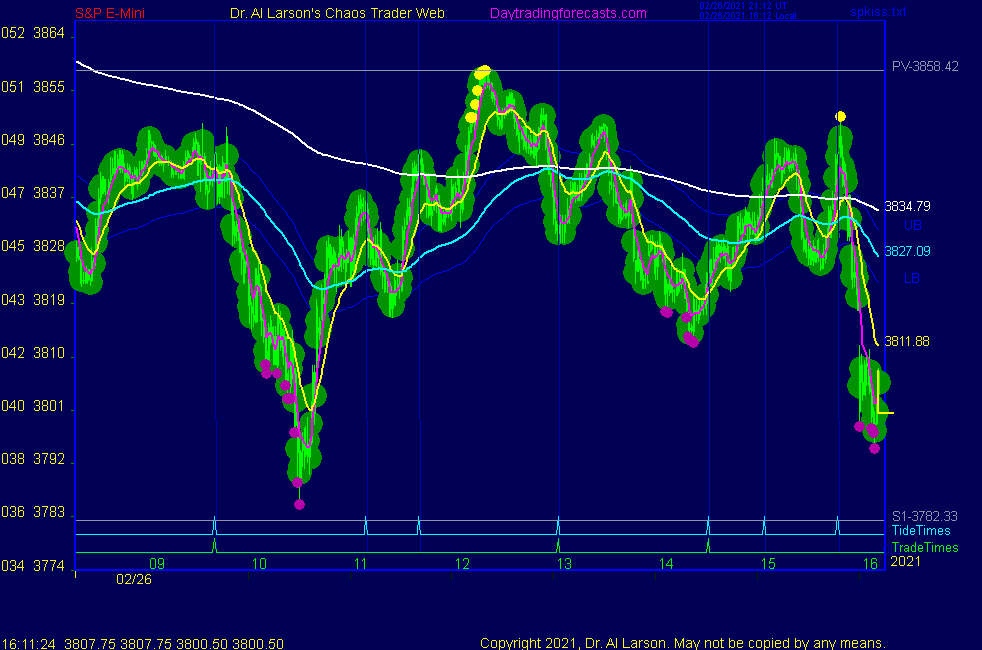
This chart is similar to charts on daytradingforecasts.com.
For more on my work and to subscribe to Tomorrows Market Email Hotline and access to daytradingforecasts.com see
Moneytide.com
Software to plot electric field flux lines in NinjaTrader is available at
energyfieldtrading.com
2/26/2021 12:31:51 PM MT TG****:: 15/20 upside cross underway right at tide time
2/26/2021 11:42:46 AM MT Al****:: gotten dull-I'm done with the Clinic; thanks for coming-see you next week-takes some courses
2/26/2021 11:14:31 AM MT Al****:: Flash Boys sold the pivot. Now on 3rd chart on SPKISS page
trading both sides of the 110 an 220 minute EXMAs. Looks to me like hold up to close. May get a short covering rally in last two hours
2/26/2021 9:54:25 AM MT Al****:: I have placed a Fractal Grid chart in the Certified Chaos Trader's Room. That room is open
to graduates of my 4 main courses. See http://moneytide.com -> Courses for details.
eMylar Fractal of Pi overlays help you be patient, since they show you future potential moves.
The best bargain in my courses is to take the Cash In On Chaos and Fractal of Pi courses and
learn to use the FOP overlay. Then take Chaos Trading Made Easy, and finish with Face Of God.
2/26/2021 9:39:33 AM MT Al****:: got a higher low on that T180 timeline
2/26/2021 8:42:39 AM MT Al****:: meanwhile, 3rd chart on SPKISS page and Chaos clinic page showed first Moontide Trade a sell- good for a quick pick - but now a fast bounce
2/26/2021 8:32:06 AM MT qq:: Thanks Al re last day managed accounts evening up
2/26/2021 7:42:27 AM MT Al****:: note Secret-esnat72 shows green support , yellow middle and white level now
2/26/2021 7:39:29 AM MT Al****:: I'm noting that the top chart on the SPKISS page shows a change in the volatility for the normal session -being last day of month may just see managed accounts evening up
2/26/2021 7:24:37 AM MT qq:: Judging from last night's WILD moves it shoul be a VEZRY volatile day!
2/26/2021 6:38:49 AM MT Al****:: Good Morning visitors. Welcome to the Chaos Clinic.
The written Chaos Clinic is on the AUX page.
This site has a lot of charts,
so you may find it useful to have several of them available within your
browser. If you have a tabbed browser, you can open separate charts
in separate tabs by right clicking on any link, and selecting "open in new tab"
from the menu. The main list of site pages is at
http://daytradingforecasts.com/chartlistsec.asp
Recommended pages to watch are SPKISS, MTRainbow, and Chat.
For astro stuff, add SPSunMoon, Wheel, and Chaos Clinic.
A special set of Dr. Al's research charts are on the Secret page.
Comments in the chat room are announced by a
"duck call" noise. This noise also occurs when the sofware detects a
resonant hex pattern on the Wheel page. MoonTide trading tutorials
are on the right side of the ListOfCharts page. One should
read Trading the MoonTide Tutorial and Keep it Simple as a minimum.
Many subcribers do not strictly trade the MoonTides, but use the charts on this
site as input to their own trading strategies. For example, the bottom chart on the
SPKiss page is good starting point for swing traders.
Also on this site is the Certified Chaos Trader's Room. That room is open
to graduates of my 4 main courses. See http://moneytide.com -> Courses for details.
9:00 Eastern-System: No comments
![]()
![]()