
Chaos Clinic Recap
Here are Al's comments
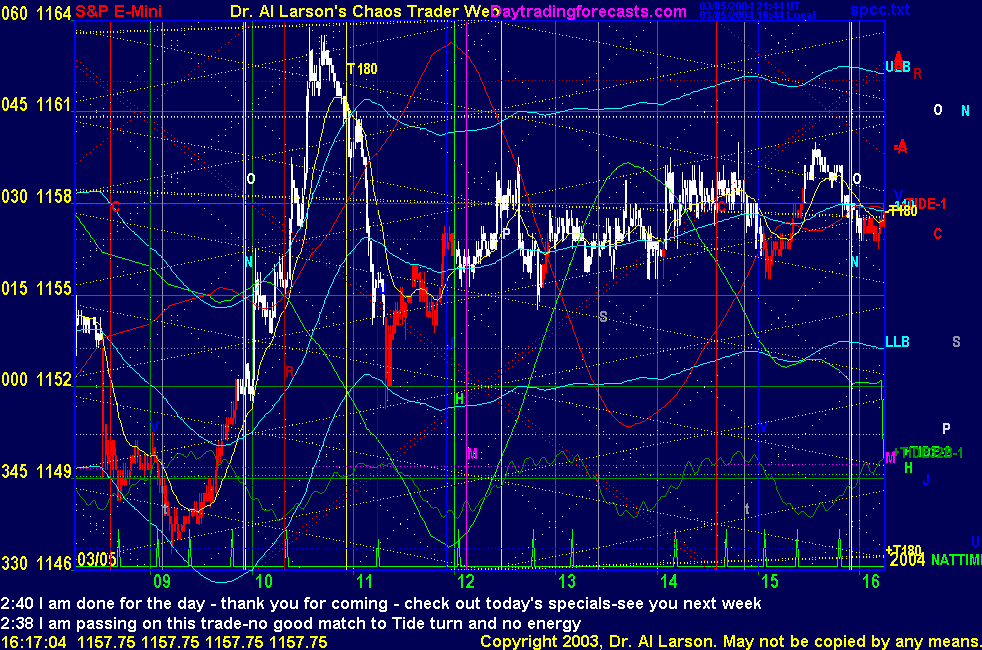
2:40 I am done for the day - thank you for coming - check out today's specials-see you next week
2:38 I am passing on this trade-no good match to Tide turn and no energy
2:34 this is a key time on Fridays-2:30 Eastern oftern marks a turn
2:25 no efficiency going up - still in trading range-may hold into the close
2:20 1158.5 is the pit resist 2 and 1158 is Venus/Moon-so having trouble going higher
2:12 that was an attempt to expand the range upward-not much success-110 EXMA not really moving
2:10 that was just a spark-again, range without net movement-low Fractal Efficiency
2:04 3 point swing up to 59-looking like a buy but I want to see how it corrects per the 20 EXMA
2:02 this is where it is easy to imagine a move starting and jump in-wait for good indicators
1:56 the price resistance is due to T-180 Moon flux, Chiron, and Venus -come the them in time 2:40-3:00
1:54 now getting some selling-needs to break this congestion to move-wait and watch
1:51 selling came in at 1158 right on the Tide time-so upside looks marginal-no trade setup yeat
1:47 the 20 and 110 EXMA's are tangled and pretty flat-and prices are recently both sides of 110-no trade indicated yet
1:43 spiky at Tide turn-nearly 2 point range on last 3 minute bar but only .25 open to close movement
1:21 still congesting going into the third Tide turn -needs to break below 1155 or above 1159 to get a good move
12:39 that spike high came as the Exchange squared Pluto -now cleary in a converging triangle
12:38 aborting for 0-I just do not like it
12:36 stop 1157 -when I am concerned about a weak move, I use the 20 EXMA as a guide to placing my stop
12:29 stop 1156 -may not be much here-from the 11:20 low I see 5 of an expected 7 moves
12:25 buying 1158 stop 1155
12:24 This is a great example of chaotic system behavior-wild moves, then dullness
12:19 looks pretty flat-this trade may well be a pass-for trading, the simple SP1Day chart is easier to use
12:15 now have a 20/110 buy with some lift on the 110 EXMA
12:00 at this Tide turn the 110 EXMA is flat and prices are both sides of it-no trade yet
11:36 the 110 EXMA is now going flat, indicating a trading range 1152 to 1161-Tides are mixed
11:27 all the way back to the 1152 major quantum-this was a failed breakout of the highs-bearish longer term
11:16 The energy really peaked as we passed the Moon-9 points back down-MoonTides said it would be a more volatile day
11:12 the pit pivot price numbers show the move went from Support 2 to resistance 4 (on sp1day page)
This is a big move for the pit, so we will likely not expand the range from here
11:05 what you have just seen is a two hour Moon streak-2 hours is 12th harmonic of the day
streak started on grey t Moon timeline and ran to T+180 yellow timeline with Moon's Node in middle
10:59 note here the little vertical drop along the T+180 timeline as the Xchg opposes the Moon
10:51 that yellow fluxline that stopped the rally is the Moon T+270-Uranus flux is above it at
1165-I expect the rally to stop up here for a while, debate, then continue or die
10:41 looks like we are betting a 90 degree = 18 point move form Uranus to Uranus triggered
by the Moon -coming into the Moon T+180 timeline
10:33 broke to new highs-this move is too fast to jump into -watch it on the Wheel of Fortune
10:28 testing the February highs
10:26 this type streak is hard to trade if you didn't get in early and hold
Need to be patient and wait for it to pause
10:16 coming out of this Tide turn we are out of band, but not breaking the 20 EXMa, so no trade
I'll settle for the +4 I got and wait for the next Tide time
10:12 notice the high was just under the red Chiron (C) flux line-just above it is the -T180 Moon
electric field flux line-the corresponding timeline is the grey (t) line, which marked the low
10:10 this type opening suggests a sidways day forming a converging triangle
10:06 notice how the high came EXACTLY where the yellow gridlines cross-The diagonal yellow gridlines
are the MoonTide Harmonic Grid-see the article about it -link is on the List of Charts page
10:04 the streak continued along the 10:00 timeline, which is a Sun resonant time-hit the upper band
9:55 out +4 -note the "streak" up the white Node (O) timeline
9:54 stop 1151-1152 is major quantum level
9:52 stop 1150.50 -cover is 1153
9:50 stop 1150-note that the jobs news drop came as the exchange conjoined Chiron
9:46 this is a trade that is early , so I move the stop aggressively-now 1149.5
9:44 I took the out of band buy at 1149 stop now 1149 -too fast to type it all in
9:40 The horizontal colored lines are planetary price lines -actually electric field flux lines
These act as support and resistance levels-clusters of these are stronger than single lines
9:38 There is a lot on this chart-the vertical lines are plnetary timelines when the exchange
makes a 0,90,180, or 270 degree angle to a planet-letters identify the planet
9:31 low on Uranus flux-dropped to out of band -may get some sort of a rally-
9:00 Weak jobs report dropped prices right to the Sun/Mer/Jup electric field flux bundle at 1049
9:00 Good morning from Chaos Manor
Besides the comments made by Al, the chat room is has live
comments from other traders who sometimes share their views,
trades and tips. Below are the chat room comments from this clinic
3/5/2004 12:42:58 PM Mountain wlj:: vacation time, last day for a while. taking march off. see you in a month or so.
3/5/2004 11:24:41 AM Mountain wlj:: tides about :45 to :60 min to the left
3/5/2004 08:52:34 AM Mountain Al:: amen
3/5/2004 08:50:58 AM Mountain wlj:: been a long time since we had a 18 jump
9:00 Eastern-System: No comments


[ Live Clinics on Friday on DaytradingForecasts.com ]