
Chaos Clinic Recap
Here are Al's comments
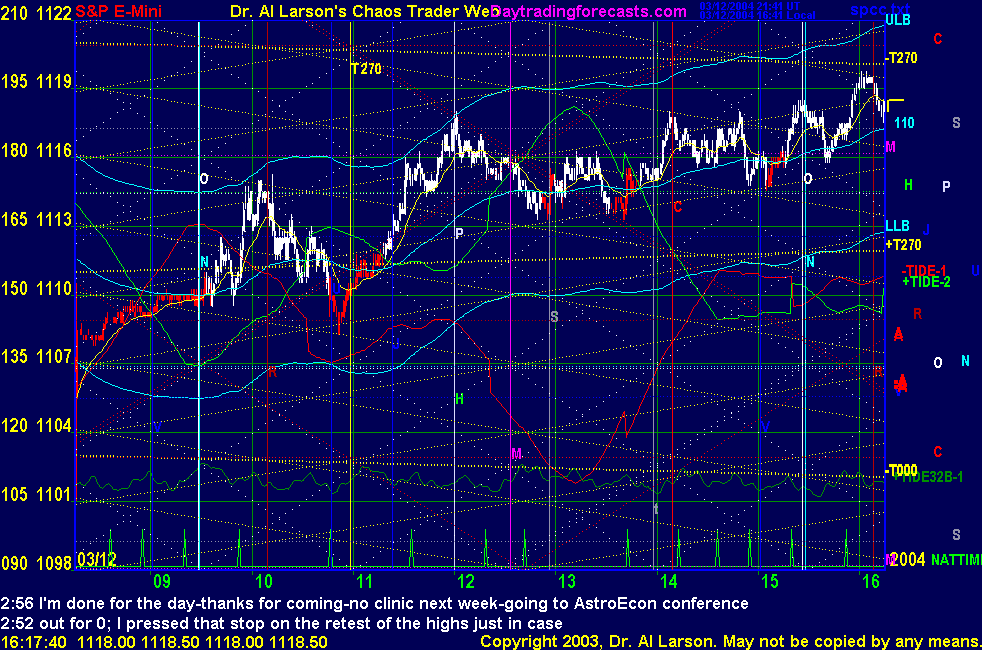
2:56 I'm done for the day-thanks for coming-no clinic next week-going to AstroEcon conference
2:52 out for 0; I pressed that stop on the retest of the highs just in case
2:49 stop 1115.5
2:47 right here the yellow and white grids both have crossings-a harmonic time
2:37 now we should see a short covering rally
2:36 that was a continuation buy-raising stop to 1115
2:33 this is last identifiable Tide time-I'll just hold trade I have
2:24 back to 110 EXMA-watching to see if it holds
2:20 remember the hex pattern?highs on Mars,sun,Chiron-next one +2 hours=close
2:11 MoonTides don't really give must help in last 2 hours so may try to hold to close
2:08 getting streak along hot Chiron timeline-Chiron price 1120.75
2:04 OK-now moving-stop 1114.50
1:56 rebought 1115.50 stop 1112.50
1:54 watching to see if hold above 110 and 20 EXMA's
1:51 geting 20/110 buy crossing-again watching for strenth
1:44 watching for a rebuy point-want to see 110 move up -note converging triangle in yellow grid
1:42 that was a head fake-still trying to go up
1:32 just not really to rally yet-now 110 EXMA has gone flat and prices both side of it
1:28 aborting -1.5; back to 110-can re-enter if it gets going
1:25 the big drop of this week is over-the next move is up and is underway
1:12 bought 1115.50 stop 1112.50-good EXMA's plus 4 moves of 7 in up Chaos Chalmshell
12:57 good exit-now watching to see if get a good continuation buy on this Tide turn
12:55 covering for +2-getting close to next Tide turn
12:48 getting enough of a drop that I may try for more than +4 ;stop 1115
12:47 here I'm watching to see if get a 20/110 EXMa sell signal-if so may drop further
12:45 stop 1115.25 -cover on an out of band trade is 4 points, or 1112
12:40 stop 1116-note the yellow grid crossing here-yellow grid is the MoonTide Harmonic Grid
12:35 minor drop on Merc timeline-lowering stop to 1116.25
12:27 automatic hex pattern recognize has found a hex make by Mars,Chiron/and Merc/Sun
12:23 stop 1117
12:21 the Sun and Moon are 15 degrees apart-making strong hourly cycles
12:18 stop 1117.5 -press it just above that high
12:16 Lower minor high
12:09 sold 1116 stop 1118
12:04 I would like it better if that last rally had hit the pit R1 at 1118.3
12:00 again hit band edge-too far from 110 for a buy-watching for break of 20 for band edge sell
11:50 Mercury flux at 1116 has stopped prices 3 times-Mercury time is 12:30-may skew the turn
11:39 this rally hit the upper band edge,setting up an out of band sell going into this Tide turn
11:12 testing the range
11:04 now back to the Moon/Uranus flux-it is the vibration center-now in a congestion
110 EXMA is flat-congestions can last 3 to 6 hours-may get dull
10:56 support came on Mars flux-note high came on Mars vertical Mars timeline
10:47 Vertical move on the Uranus timeline-hot due to the Moon
10:38 now coming to the Moon/Uranus timeline with price on the Moon/Uranus flux line
10:27 that rally was stopped by the Sun square Pluto flux pair at 1114.5
10:12 stopped out +1 -this is not good for the bulls longer term
10:07 stop 1112.5
10:03 stop 1110.5
9:48 stop held past first pullback -move to 1109.5 -cover is 1116.5
9:41 bought 1111.5 stop 1108.5
9:37 20/110 buy crossing-needs follow through-
9:33 popped right up to the Moon flux and met resistance
9:31 opening with 110 EXMA flat and prices near Moon/Uranus/pivot level
9:00 Good morning from Chaos Manor
Besides the comments made by Al, the chat room is has live
comments from other traders who sometimes share their views,
trades and tips. Below are the chat room comments from this clinic
3/12/2004 09:35:02 AM Mountain TG:: gmm your welcome. peb, thanks I'll look into the software.
3/12/2004 09:24:50 AM Mountain gmm:: tg thanks for the imfo that helped..
3/12/2004 09:20:17 AM Mountain peb:: Try Wave59 RT. It allows proper scaling and you can set the chart time independent of the data collection time. I use it with E-Signal. I run my time from 8:20am - 4:15pm and get virtually identical to AL's
3/12/2004 09:15:05 AM Mountain TG:: I had the same ? for Al a few days ago. His reply: "Technically, I only include the data between 8:15 and 16:15 Eastern in my
EXMA's. This can make them slightly different from a 24 hour system, but the differences are small." At least they are usually small and as you get passed 11:00 Eastern your EXMAs should look the same as on this site. I checked around and from what I see there aren't any off the shelf charting programs where you can set the moving averages from a specific time period, just 24hrs or from the open.
3/12/2004 08:06:12 AM Mountain gmm:: Al,my esignal 20/100 is the same as mm.what time settings are you useing?
3/12/2004 07:52:36 AM Mountain mm:: Al, my 20/110 on eSignal crossed at 7:53 EST and the 20 has been above the 110 since. How come yours crossed just now?
9:00 Eastern-System: No comments


[ Live Clinics on Friday on DaytradingForecasts.com ]