![]()
![]()
**************************************************************************************
Moon Bounces In The S&P
Chaos Clinic for 3/17/2023
***************************************************************************************
Decades ago, amateur radio operators developed a novel long distance communication technique
by bouncing radio signals off the Moon. Traders can imitate them.
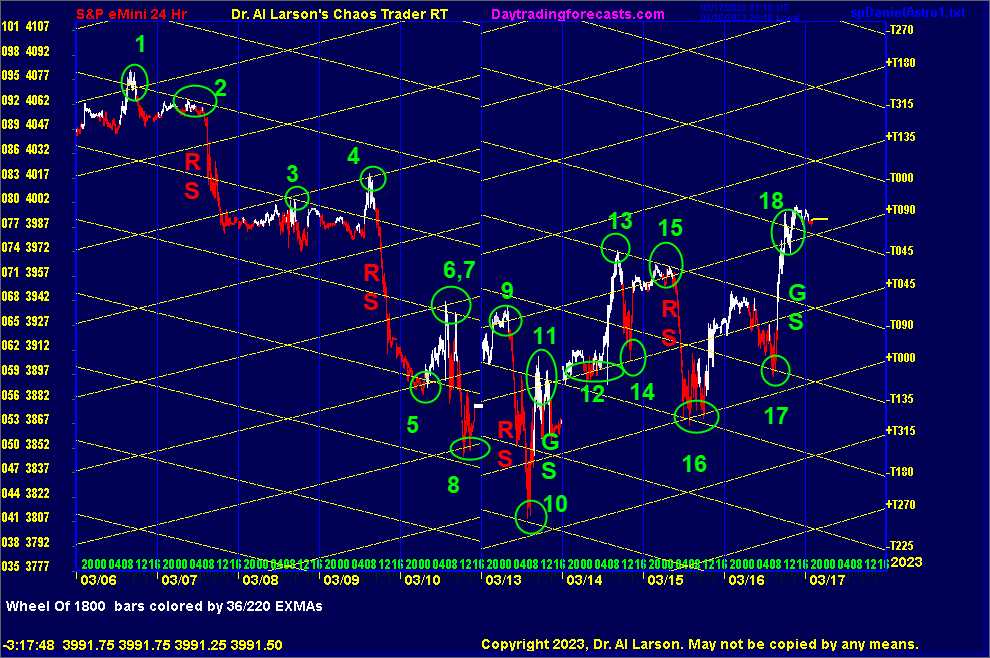
The Moon has a strong effect on the S&P. This has been very clear in the last 9 days.
This 24 hour chart shows the Moon's electric field flux lines, both up and down, spaced
every 45 degrees. A series of points are circled and numbered. The numbers are
not any sort of wave count, just reference points for discussion. Prices are scaled to the Wheel of 360.
Crossovers of the up and down lines are often key times. Point 1 marks a day when
the market rallied, then faded. From there the market moved sideways to point 2, where
the down flux repelled price. Then as Powell talked, prices followed a red swan (RS) down.
Many red swans do not have big effects, but if they start near a Moon flux they can be powerful.
Sometimes the Moon flux just stop prices. Often this occurs in a double test, like at 3. I call
these "baby bird's mouths." Sometimes the bounce is just sharp and fast, like at 4. That bounce
started another drop along a red swan. That drop, measured using the up flux, dropped 135 degrees,
a 3/8 Fib ratio of the circle.
That drop slid sideways to the crossover at 5, where prices turned up. After testing the up flux, they
bounced up point 6 on the up flux, then down again to the lower up flux, and back up to point 7. This
point stopped on the down flux. That drop fell to make a bird's mouth at point 8. That was a pretty
wild and choppy Friday, but watching the Moon bounce helped sort it out.
Over the weekend, prices bounced up to 9 on an up flux, then dropped sharply to the down flux at point 10.
This happed to be the end of a down Fractal of Pi from point 1. That down fractal traveled 180 degrees
from the -T090 flux down to the -T270 flux.
When Monday's prices ran up to point 9, a trader may have thought that the fractal had failed. But when
the drop came, one could focus on covering near the end of the fractal, knowing 180 Moon channel degrees
was a common fractal size.. A red swan was part of this drop, but the zigzag in the middle make it not exact.
Note that zigzag bounced off a pair of up and down Moon flux.
The bounce from 10 ran up to 11, following a green swan. It oscillated near the crossover.
The next day, prices based on the up flux at 12, awaiting the CPI report. When the report came out,
it ran right up to 13, stopped by the down Moon flux. Then prices dropped to the up Moon flux at 14.
That flux bounced prices up 45 degrees, where they followed the +T090 flux , but minor rallies were
stopped by the down -T090 flux. See point 15.
Then prices encountered a red swan, dropping prices 90 degrees down to 16, where they formed a choppy bottom.
The bottom formed on -T180 and +T000. The following rally failed to reach -T090, indicating weakness.
The following pullback found support on the down going -T135, then rallied on a green swan to 18, near the crossover
of +T090 and -T090. for the week, prices worked in an up channel between +T000 and +T090.
Clearly the S&P likes to bounce off Moon electric field flux lines. I find them most useful for swing trades
ranging from over night to 7 or 8 days. Our week is basically a quarter Moon cycle. The Moon flux act like the
barriers in a pinball machine, bouncing prices around in a chaotic but harmonic fashion.
For more on my work and to subscribe to Tomorrow's Market Email Hotline and access to daytradingforecasts.com see
Moneytide.com
Software to plot electric field flux lines in NinjaTrader is available at
energyfieldtrading.com
3/17/2023 1:14:27 PM MT Al****:: seems to have a lack of juice late in the day -I'm calling it a day- thanks for coming-see you next week
3/17/2023 12:16:22 PM MT Al****:: may make it down to the +T000 Moon flux channel bottom
3/17/2023 12:11:29 PM MT Al****:: now being affected by the red swan
3/17/2023 12:05:22 PM MT Al****:: bounced up to -Mh000 and got repelled
3/17/2023 11:54:08 AM MT Al****:: besides the Moon, Mercury flux lines show up well in the S&P
today there is a pair nearby - the last minor blip up hit the +Mh000 flux. Just above it is the -Mh000 flux, about where the 440 EXMA is
3/17/2023 11:45:03 AM MT Al****:: trade has stayed below the down 440 minute EXMA
we have Chiron and Jupiter time lines neat 14:00 , and Moon, Node, and Venus time lines just after 15:00
3/17/2023 11:35:42 AM MT Al****:: odds still favor a move 5 decline as we com to a red swan
3/17/2023 11:31:51 AM MT Al****:: like many Fridays volatility has dried up in the afternoon
3/17/2023 10:51:59 AM MT Al****:: note on that chart how precise the vibration levels are
and note the lower yellow vibe was support, is now resistance
3/17/2023 10:39:42 AM MT Al****:: note on secret->esnat72 little run up the vertical green line
3/17/2023 10:19:10 AM MT Al****:: from the high we have a 1-2-3-now in 4 moves of a Chaos Clamshell
3/17/2023 9:04:42 AM MT Al****:: usually the Flash Boys move prices 2 pit levels - S1 is 3973, below -T135
3/17/2023 9:00:43 AM MT Al****:: the pit R1 price coincides with -T045; giving up that price
suggest a move to the pivot or S1
3/17/2023 8:55:18 AM MT Al****:: since we know the up channel is 90 degrees wide, we can watch for a move to the +T000
3/17/2023 8:52:54 AM MT Al****:: now prices have dropped 45 degrees to the +T045
that did give a good sell on the EXMAs almost exactly at trade time
3/17/2023 8:37:12 AM MT Al****:: and it is a good example of the interaction of the rotating earth with the Moon; the exchange rotated past
Moon conjoin Pluto, sending prices up to the +T090 flux which repelled them
3/17/2023 8:33:57 AM MT Al****:: yes
3/17/2023 8:06:05 AM MT TJ:: Hi Al. Is today a Moon-noon-Moon or Moon-Moon day?
3/17/2023 6:57:33 AM MT Al****:: This morning prices rolled over and dropped below the +T090 Moon flux, aided by a red swan, as per the Chaos Clinic write up. I am running a live version of my Moon flux chart in the CCT Room. Also in that room an automated Face Of God chart shows the drop from the high. Further, on the SPKISS page the rally stalled at the 48 day EXMA.
3/17/2023 6:22:55 AM MT Al****:: Good Morning visitors. Welcome to the Chaos Clinic.
The written Chaos Clinic is on the AUX page.
This site has a lot of charts,
so you may find it useful to have several of them available within your
browser. If you have a tabbed browser, you can open separate charts
in separate tabs by right clicking on any link, and selecting "open in new tab"
from the menu. The main list of site pages is at
http://daytradingforecasts.com/chartlistsec.asp
Recommended pages to watch are SPKISS, MTRainbow, and Chat.
For astro stuff, add SPSunMoon, Wheel, and Chaos Clinic.
A special set of Dr. Al's research charts are on the Secret page.
Comments in the chat room are announced by a
"duck call" noise. This noise also occurs when the software detects a
resonant hex pattern on the Wheel page. MoonTide trading tutorials
are on the right side of the ListOfCharts page. One should
read Trading the MoonTide Tutorial and Keep it Simple as a minimum.
Many subscribers do not strictly trade the MoonTides, but use the charts on this
site as input to their own trading strategies. For example, charts 5 and 6 on the
SPKiss page are a good starting point for swing traders.
Also on this site is the Certified Chaos Trader's Room. That room is open
to graduates of my 4 main courses. See http://moneytide.com -> Courses for details.
9:00 Eastern-System: No comments
![]()
![]()