![]()
![]()
**************************************************************************************
Market AstroPhysics Of A Chaotic Day
Chaos Clinic for 3/17/2023
***************************************************************************************
Market AstroPhysics is based on the physical universal elect4ric field. This begins
with energy stirred up on the Sun, which travels to the earth via the solar wind, where
the Moon intercepts or reflects it, as the earth rotates any point on earth, such as
a stock exchange, past all of the planets. All of this shows up in markets.
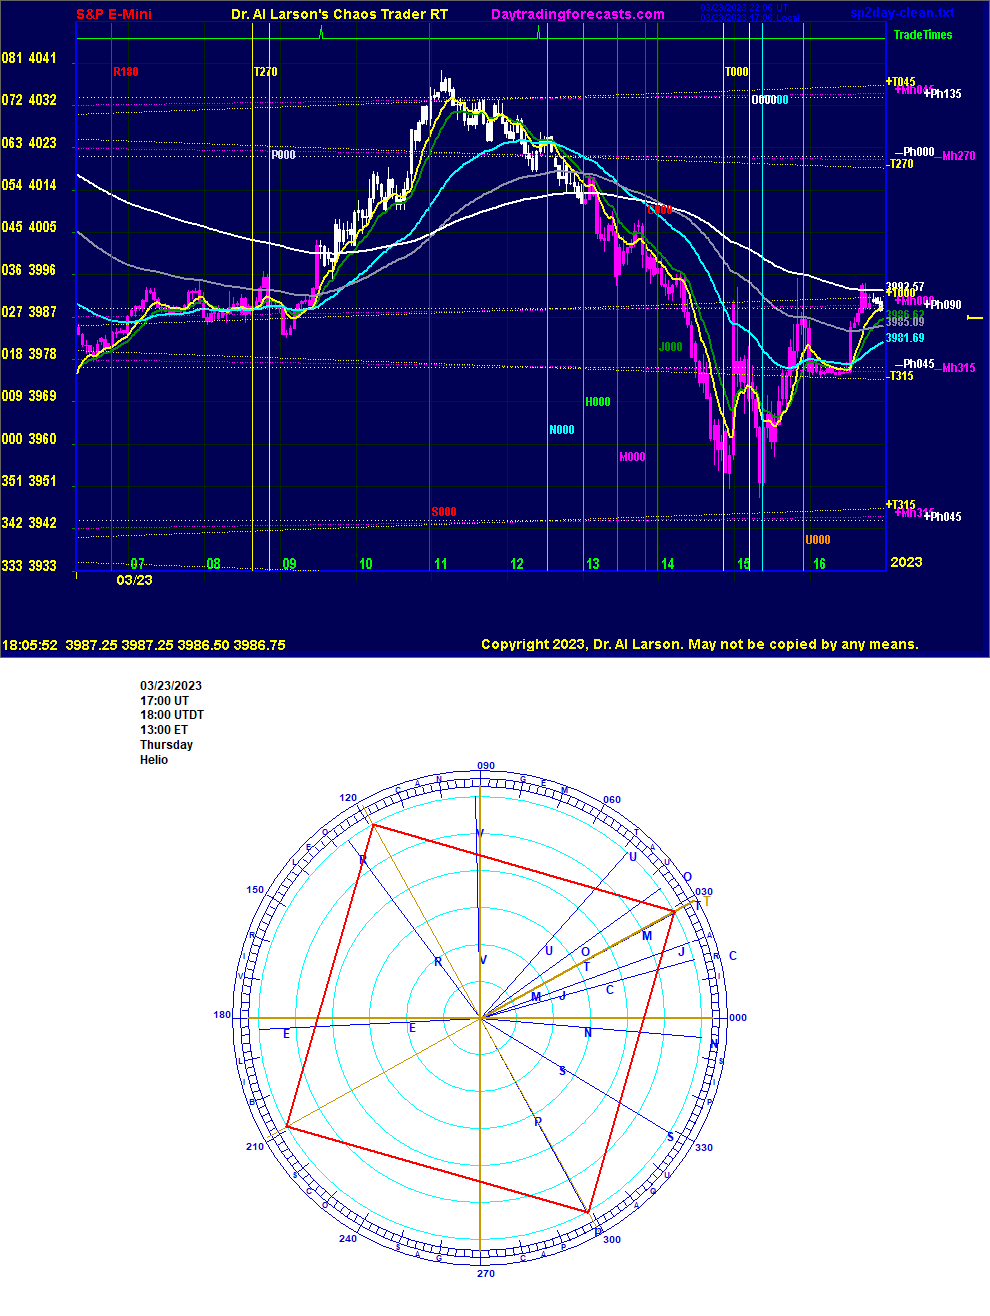
This chart of the S&P on 03/23/2023 is an example. Below the market chart is a heliocentric
epheris. It show Mercury squaring Pluto. In the computation of the Master Clock solar stirring force
(see Stocks and Commodities "In Search Of The Cause Of Cycles") these two planets contribute about 80 percent
of the stirring force. The Moon aligning with Mercury focuses the energy as it arrives at the earth.
This shows up in the price chart, which has helio Pluto and Mercury electric field flux lines,
as well as vertical time lines showing when the exchange gets rotated past the various planets.
Early in the day, prices moved along the Moon +T0, Mercury +Mh000, and +Ph090 flux lines.
Then, shortly after the exchange move past Pluto P000 andMoon T270 time lines, prices began
a rally. This rally moved a harmonic 45 degrees up to +T045, +Mh045, and +Ph135 flux lines.
Then as the Moon +T045 flux crossed through the +Mh045 and +Ph135 flux, the attraction
changed to repulsion, turning prices down. This came just after the exchange rotated past Saturn S000
time line.
The decline continued until the exchange rotated past the Moon T000 time line. Then a double bottom
formed as the exchange rotated past the Moon's Node O000 timeline, which overlays the Venus V000 timeline.
After that, the major effect was over. By the close, prices had recovered to the set of Moon, Mercury,
and Pluto flux lines where they were earlier in the day..
This is an example of using Market AstroPhysics to figure out WHY prices are doing what they are.
If one can do this in real time, it helps one trade with more confidence. I don't always do this,
but on this day I did.
I did not explain WHY the high came near the Saturn time line. That is left as an exercise for the student.
For more on my work and to subscribe to Tomorrow's Market Email Hotline and access to daytradingforecasts.com see
Moneytide.com
Software to plot electric field flux lines in NinjaTrader is available at
energyfieldtrading.com
3/24/2023 1:48:39 PM MT Al****:: I'm done for the day-thanks for coming-see you7 next week-take some courses-learn to Cash In On Chaos
3/24/2023 1:44:57 PM MT Al****:: it still may make 4005, but my trader has a rule "Take while your got it"
my scientist can studied things later
3/24/2023 1:41:48 PM MT Al****:: close enough - took profits at 3997.25
3/24/2023 1:23:48 PM MT Al****:: up to the -Vh225
3/24/2023 1:21:54 PM MT Al****:: stop to 3985
3/24/2023 1:19:18 PM MT Al****:: during this rally the lows have been supported by the 110 minute EXMA
3/24/2023 1:16:49 PM MT Al****:: coming to the Venus time line
3/24/2023 1:09:32 PM MT Al****:: last hour-flat on +Ph090 -pushed my stop up to 3983
3/24/2023 12:46:38 PM MT Al****:: I do trade my own stuff-today I bought 3974, stop is now 3977, and cover is 4005
3/24/2023 12:40:57 PM MT Al****:: early analysis is looking good
Moon flux +T000 and Moon time line T000 is the energy attractor
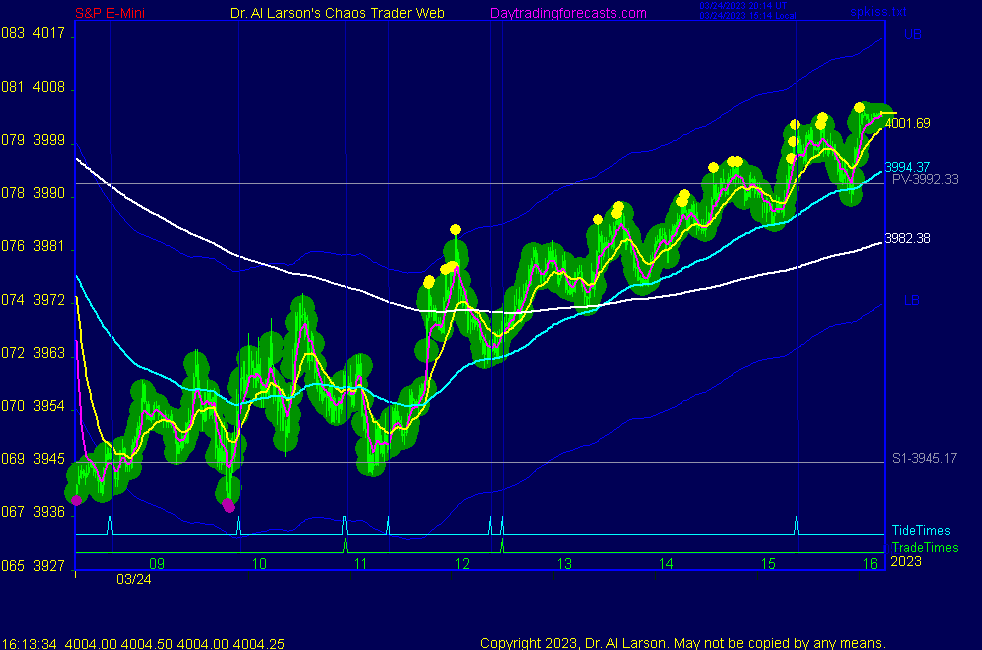
3/24/2023 12:23:34 PM MT Al****:: if you look at secret->esnat72 you see support was on the green vibration, now up to higher green
dip on the vertical magenta line was to yellow vibe, so could make next yellow up
3/24/2023 12:17:03 PM MT Al****:: this is about the time of day when the bears realize they were wrong and start covering their shorts
3/24/2023 12:02:58 PM MT Al****:: gained energy rotating past Jupiter
3/24/2023 11:40:29 AM MT Al****:: if you look at the Chaos Clinic page you see prices have now caught a green swan
see the article MoonTides and Black Swans linked on the right side of the ListOfCharts page
3/24/2023 11:33:59 AM MT Al****:: got energy rotating past Mercury
3/24/2023 11:29:04 AM MT Al****:: I posted a Fractal Of Pi chart in the CCT Room
3/24/2023 11:17:42 AM MT Al****:: one has to be patient and wait for the earth to rotate
coming to Mercury time line
3/24/2023 11:04:49 AM MT Al****:: note on SPKISS chart 3 the EXMAS signaled a buy at the 12:30 MoonTide trade time
3/24/2023 10:39:13 AM MT Al****:: today is actually a Two Moon day
but somewhat messy- exchange passing Pluto then Moon T270 turned market up - Base price was on +Ph045
Two Moon days can run Moon to Moon-today just before the
close the exchange passes Venus and the Moon
last dip found support on +Vh270
a 45 degree move to +Vh315 about 4007 is possible
3/24/2023 10:32:04 AM MT Al****:: Thanks PAB
3/24/2023 7:22:51 AM MT pab:: Noting in a rare cosmic event, five planets will be visible in the sky after sunset from March 25th to 30th. Mercury, Jupiter, Venus, Uranus, and Mars will align with the moon in a great arc across the sky.
3/24/2023 7:12:03 AM MT Al****:: Good Morning visitors. Welcome to the Chaos Clinic.
The written Chaos Clinic is on the AUX page.
This site has a lot of charts,
so you may find it useful to have several of them available within your
browser. If you have a tabbed browser, you can open separate charts
in separate tabs by right clicking on any link, and selecting "open in new tab"
from the menu. The main list of site pages is at
http://daytradingforecasts.com/chartlistsec.asp
Recommended pages to watch are SPKISS, MTRainbow, and Chat.
For astro stuff, add SPSunMoon, Wheel, and Chaos Clinic.
A special set of Dr. Al's research charts are on the Secret page.
Comments in the chat room are announced by a
"duck call" noise. This noise also occurs when the software detects a
resonant hex pattern on the Wheel page. MoonTide trading tutorials
are on the right side of the ListOfCharts page. One should
read Trading the MoonTide Tutorial and Keep it Simple as a minimum.
Many subscribers do not strictly trade the MoonTides, but use the charts on this
site as input to their own trading strategies. For example, charts 5 and 6 on the
SPKiss page are a good starting point for swing traders.
Also on this site is the Certified Chaos Trader's Room. That room is open
to graduates of my 4 main courses. See http://moneytide.com -> Courses for details.
9:00 Eastern-System: No comments
![]()
![]()