
Chaos Clinic Recap
Here are Al's comments
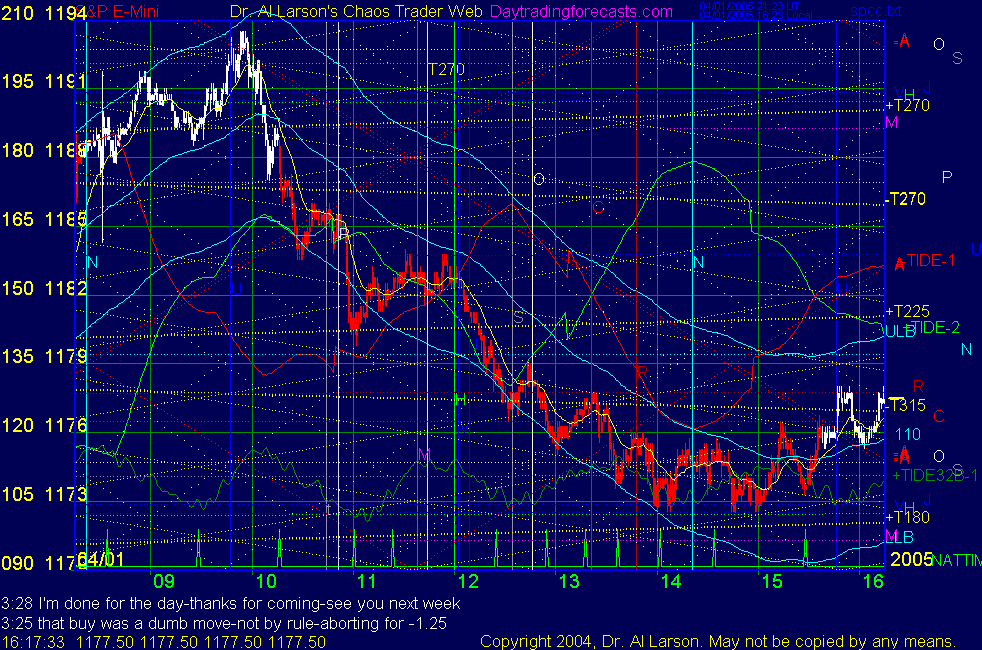
3:28 I'm done for the day-thanks for coming-see you next week
3:25 that buy was a dumb move-not by rule-aborting for -1.25
3:16 my clue to cover was that the test of the lows held, as an exact double bottom
3:12 bought 75.50 stop 72.50
3:10 by rule covering on stall for 0
2:58 stop 1176
2:55 still OK-time to fish or cut bait
2:44 so far so good-here I just watch the 20 and 110 EXMA and ignore all the astro crap
2:40 treading water below the 110 EXMA, 20 is flat-sit tight
2:24 sold 74 stop 77
2:20 coninutation sell setup -I'll sell if drop to 1174
2:05 I expect the dauy to end on the green +Tide -last leg down-will shop for a sell on next Tide turn
2:02 our position long was stopped for a small gain - obviously major selling today - very hard to day trade
about all one can do is to sell the rallies and trail a stop above the 110 EXMA-not our normal rules
1:58 I'm back-this is a one way day -In my past newsletters I said the market was up until 3/31 major pattern
that is a helio pattern and is strong
1:15 I am now going to take a break for about an hour-the last Tide turn may be tradable if I'm fresh
1:13 this has been a vertical day -very hard to trade unless you get in on the start
1:11 now have an 18 point range-in 3 hours-normally takes 2 days
1:09 aborting for zero-stalled
12:57 sold 1176 stop 1178-taking as continuation sell-inverted to red -Tide
12:54 stopped - I don't really like OOB trades -that one looked OK
12:51 1178 is the pit traders support 3-high was resistance 4 -just have to see if it works
12:42 bought 1178 stop 1176 -oob trades are counter trend , so less potential
12:35 this is an out of band buy setup-I'll buy if we get a fast move up above the 20 EXMA
12:24 down to the Mars/Moon email hot price-thought it might be an early low-maybe a midday low?
12:20 testing the lower band-this sets up a possible out of band buy-but I want to see some upside juice
12:10 some more selling going into the green +Tide low-I'm watching to see how we come out of it
11:55 back up to the harmonic with the Sun Uranus flux line as Xchg passes the sun-
This astro stuff is fun to watch, but I trade mostly off the simple things-patterns and my chaos indicators
11:43 now we are coming into the lunch hour doldrums-things will quiet down-note low exact on 11:01 Natural Time
11:35 the S&P gets pretty wild going into an eclipse-the solar eclipse is next Friday
11:31 looks like the range of the day is set, and we will now trade within it
11:25 I just finished a Face of God analysis and posted it in the private Certified Chaos Trader room
11:08 down to the Moon +T225 flux as coming into the +T270 Moon timeline-Node high says Moon is hot
10:58 one of the hardest things to do is watch a good trade that you missed-you have not learned discipline
until you can do that without emotion-remember-you are not missing the information-collect it for later use
10:43 so why would Uranus be so hot? Mercury is 30 degrees to it (12th harmonic), and
Sun,Jupiter+180,Venus are 36 degrees away (10th harmonic) setting up a 5:6 harmonic ratio
10:36 note that the high came on the vertical blue Uranus (U) timeline-dropped to horizontal Uranus flux line
Uranus is associated also with earthquakes
10:29 in hindsight, that would have been a great "almost out of band sell" - but I did not plan to take it
one must not expect to be perfect and to get every turn-just find a few, trade them by the rules,
and it works over time
10:22 why do I think that? prices have moved an equal amount above and below the 110 EXMA very quickly
10:19 lots of sparks -Moon/Pluto support -now watch for the battle to degenerate into a congestion
10:12 the 110 EXMA is tracking the green +Tide very well - could have picked this Tide turn as a
trade, but did not because it is so broad-will wait until later -patience is required
10:07 the email Saturn/Node price stopped the rally -the Node is part of next week's eclipse
10:02 out -1 ; the only thing you control is your risk-if a trade sets up, take it, but manage the risk
10:01 today's high equals the high just before the "Fed drop" on the 22 nd-strong resistance
10:00 this is a "late throw over the middle" in football terms
9:55 stop 1191 -midway between 20 and 110 EXMA
9:52 OK, got a chance to buy 1192 stop 1189 -will press stop fast
9:47 I missed the buy there because I got distracted by a phone call-I'll not chase it-don't trust it anyway
9:41 the green +MoonTide now flattens out-it called the pre-open move, but it looks to be spent
9:38 Remember, this is April Fool's day-why else would a weakening economy be good news?
9:36 this is a possible continuation buy setup, but I want to see the pre-open high fail
9:32 highs set by Jupiter/Venus/Sun - geo Mer,Ven,Sun conjoining, opposing Jup, square Moon_
9:27 opening on email Mercury/Moon 1189.5 -not much upside potential-may be no early trade
8:55 Weak jobs news sparked early rally as per the green +MoonTide
8:50 Good morning from Chaos Manor
Besides the comments made by Al, the chat room is has live
comments from other traders who sometimes share their views,
trades and tips. Below are the chat room comments from this clinic
4/1/2005 11:30:56 AM Mountain wlj:: patents, it's the winter / early spring issue, just came out. its a 3 page article on earth cycles. 1-800-288-4266, mag number. 19.95 a year, astro/gann etc type mag. sometimes you will see an article by some guy named al larson.
4/1/2005 11:20:33 AM Mountain Patents:: Al: With the 18 point range that you said normally takes two days - if the market breaks down again and extends that range, does it mean that we are likely to move down to the next 18 point level? If so, is that a leading indicator such that it means to close the position trade? At this point it is probably academic since the stop would be hit about the same time.
4/1/2005 10:55:25 AM Mountain Patents:: Al: thnx. WLJ: much thnx too. Did you read the article? Is it interesting and worthwhile (since I have to find/buy the mag)?
4/1/2005 10:41:23 AM Mountain Al:: this is a stong decline-range expansion down means probably down into close unless some strong buying comes in
4/1/2005 10:39:19 AM Mountain wlj:: patents, new issue of traders world mag, " earth disturbance cycles " by eric hadik
4/1/2005 10:26:16 AM Mountain Patents:: Al, you said that the range was possibly set. Now it broke down the range. Does this have any meaning in and of itself? Can this imply a sustained move down into the close?
4/1/2005 10:05:43 AM Mountain Patents:: Thnx. I was wondering if there was any evidence of or work on this particular relationship that I came across on the web today. They said that there was a 50 hour correlation, location non-specific. And the Pacific plate seems to have remained exceedingly active the past week.
4/1/2005 10:00:11 AM Mountain jsb:: EARTHQUAKES !!! NOT QUACKS LOL
4/1/2005 9:58:30 AM Mountain jsb:: patents,,, if your interested there is a guy out there louis turi,,,who has seems to be able to predict earthquacks with scary accuracy via the stars... drturi.com
4/1/2005 9:56:38 AM Mountain Patents:: Thnx.
4/1/2005 9:55:52 AM Mountain Al:: No, I don't-I quit doing earthquake work after forecasting one in that killed thousands-I couldn't figure out the where-just the day-and with no way to credibly warn people I decided not do do it - I'm sure there are lots of solar linkages, though
4/1/2005 8:52:22 AM Mountain Patents:: Al, I believe that I recall some earlier chats in which you said that you follow earthquakes or used to do some work regarding earthquakes. Do you know anything about a possible correlation between the time of a major anomalous gamma ray burst and the occurrence of a earthquakes? Thnx.
4/1/2005 7:56:34 AM Mountain wlj:: strong adv iss, maybe some up side mo
4/1/2005 6:56:15 AM Mountain Al:: turning off alarm
9:00 Eastern-System: No comments


[ Live Clinics on Friday on DaytradingForecasts.com ]