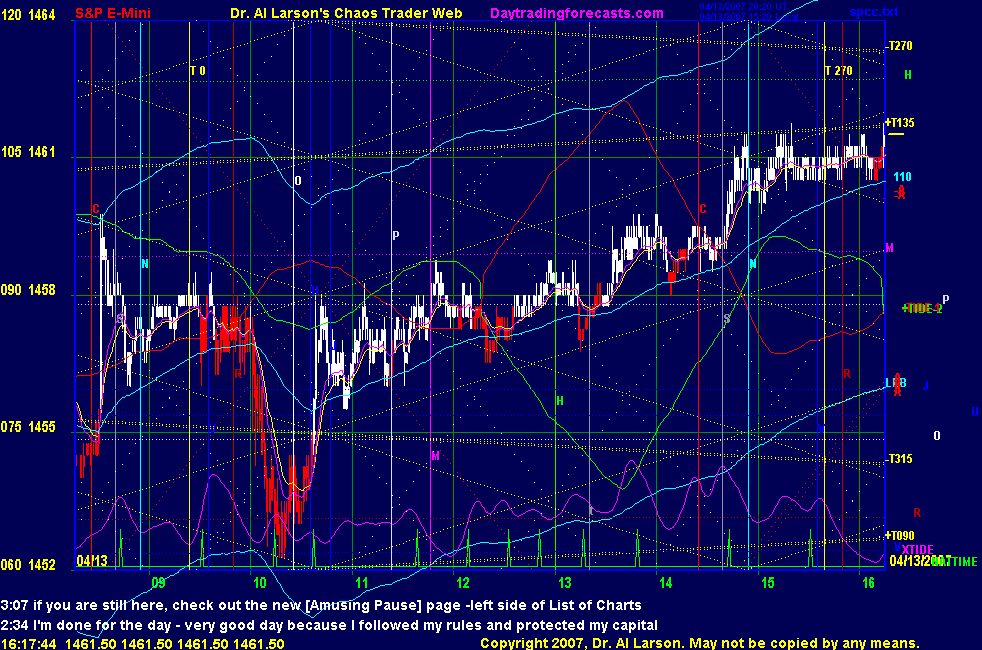


12:09 it is also very important not to sit and stare at a screen when daytrading, especially when the market is dull.
It takes your brain .5 seconds to process everything and make you aware of the result. If you enter a trade, you
form a feedback loop to what you are watching, and become part of the system. You can build an oscillator. An oscillator with a .5 second delay
element oscillates at 2 hz- the Delta deep sleep brain wave freqency. You then zone out and become a trading zombie.
Results are usually not good. At the end of the day you may ask, "Who the hell was that?"
12:02 it is very important to stay out of dull markets - they get you into a trade, then frustrate you, and induce you
into making mistakes; here the Mercury flux helped me stay out-did not break it after passing Mercury timeline
11:55 top wick on 3 minute candle at TideTime - small bodies in candlesticks make me cautious
11:52 marginal new outcry high -still watching
11:47 no, Scamp is more active -trying to eat my keyboard now
11:43 this market is about as active as the puppy sleeping in my lap :)
11:36 prices are trading above the 110 and the 20 is staying above it, so a possible buy is suggested
may get energy from the Mercury timeline
11:34 coming into the next trade time it is dull -I want to see some juice before I trade
11:20 there are many trading systems that watch the first hour to select a strategy for the day-today they
saw down, so the will be biased to the sell side.
11:13 if you look at the Wheel now, you see X, the Exchange, and A, the Moon harmonic closest in speed to X,conjoining, both opposing
B, the Moon harmonic that forms the MoonTide Harmonic Grid. And price is square to these fast cycles.
11:08 still looks like a trading range day
11:00 getting another hex pattern-Sun,Jupiter,Saturn Grand Trine, with Neptune sextile-a thing of beauty
price found a harmonic point to this pattern at 1456.25- price responding to multiple inputs according to the laws of harmony
10:57 getting a fade off the resonant streak high
10:47 there are many harmonic events going on - I often see Venus and Uranus work together- here we hit Venus price
at Uranus time. They are 75 degrees apart, a multiple of 15 degrees. The earth moves 15 degrees per hour, so
multiples of it are important in intraday work
10:40 Good job, Al, side stepping a 5 point pop :) . I did that just watching the KISS chart and the EXMA's
now I can look at the Chaos Clinic chart and see that we got a streak up the Uranus timeline right up to the
crossing in the diagonal yellow MoonTide Harmonic grid
10:37 I also did not like the 20 and 110 EXMA's curling up as we came to the exact TideTime
10:35 I did not like no net gain 25 minutes into the trade on an "emotional" move
10:33 aborting -.25-don't like it
10:30 last 2 3 minute candles had big top wicks -favorable to the trade; confirms stop in good place
10:26 that support may fail-below it on the Wheel is a gap down to the Sun -a possiblily-just work the stop
10:25 a quick peek at the Wheel and the Clinic chart told me WHY there was support near 52-Moon/Venus -just work stop
10:20 stop 55 - now had time to check the report -sentiment weaker than expected - prices already said that
10:17 a fast move will not recross the 20 EXMA, so can use it as a stop guideline
10:16 stop 55.5 -trailing by 3
10:14 right now I'm only looking at my Kiss chart on the Aux page to see where I can put my stop
10:10 stop 56 -trade is early so press stop
10:08 OK, sold 54 stop 57
10:07 did not break out of the trading range , at least not yet , so still watching
10:04 getting the emotional reaction to the Consumer Price Index report-just watching for now
10:00 if you have your sound on, you hear a beep, and see an alert message about a hex pattern
this is on the Wheel of Fortune page - hex patterns are harmonic patterns formed as price interacts with planetary flux lines
9:56 reducing complexity to simplicity is what our brains do-our body senses 10,000,000 bit per second; our
conscious thoughts are about 40 bits per second-a great simplification
similarly, the MoonTide forecast strives to reduce the complexity of all the astro stuff to just a few key trade time windows
9:52 the preopen action set a trading range -initially, I expect us to stay in that range
9:41 you can open 3 copies of your browser and watch the Chaos Clinic, the Aux, and the Wheel pages at the same time.
That gives you a good view of what is going on. The astro stuff gives you good background, but when I trade, I just
focus on the simple chart, like SP1day or the one I have up on the Aux page.
9:38 the Chaos Clinic page shows astro time lines and price lines (electric field flux lines).
Astro information is
also shown on the Wheel of Fortune page. Right now it shows price 180 degrees to Pluto
9:34 The Chaos Clinic page shows the real complexity of what is happening via Market Astrophysics; it can be very useful
if you understand and study it, but the information will overload your brain if you are pressed for time, so reducing
the complexity to something simple is very helpful for just trading.
9:32 on Aux page I am running a Keep It Super Simple chart today
9:31 a bit of excitement pre-outcry on the PPI news - first trade about 10:40 Eastern
9:00 Good morning from Chaos Manor
9:00 Eastern-System: No comments