![]()
![]()
********************************************************************************
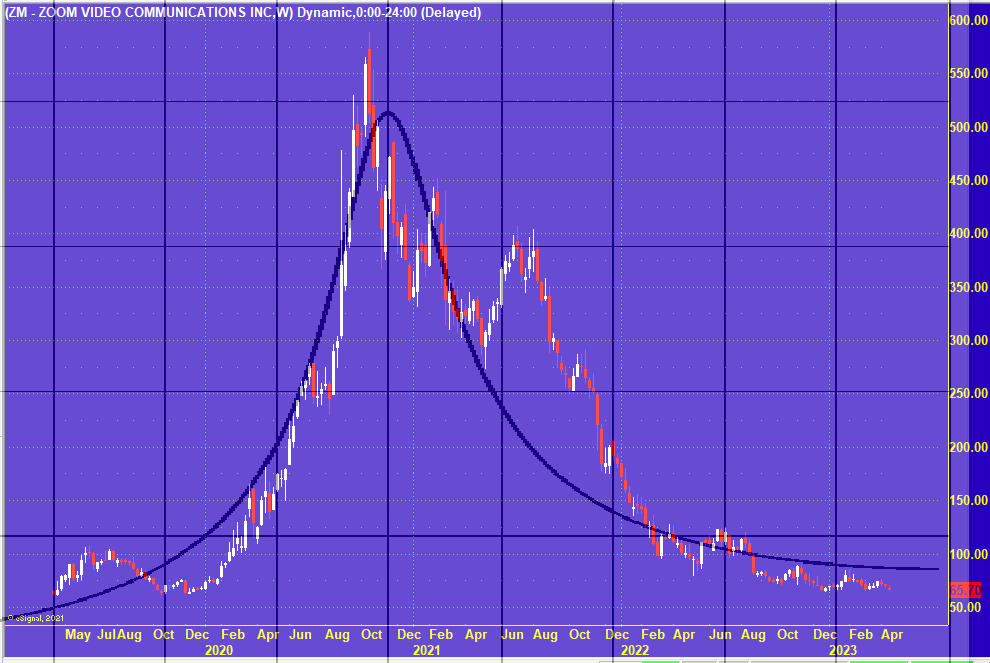
The Rise And Fall Of ZOOM
Chaos Clinic for 4/21/2023
********************************************************************************
Since my 9/18/2022 Clinic, Zoom Zooms With Astro Power ,
Zoom has peaked, and collapsed. This chart shows this.
Zoom thrived during the COVID pandemic, with lock downs requiring lots of remote meetings
and remote schooling. But with the easing of the pandemic and increased competition,
Zoom's stock price fell.
The interesting thing is that this is another case of "time domain resonance." The overlaid
curve is the computed curve for an electronic tuned circuit, which is used to tune radios
to different stations. This makes sense, since all trading is affected by the universal
electric field.
For more on my work and to subscribe to Tomorrow's Market Email Hotline and access to daytradingforecasts.com see
Moneytide.com
Software to plot electric field flux lines in NinjaTrader is available at
energyfieldtrading.com
4/21/2023 12:38:45 PM MT Al****:: tested high on Moon timeline, then dropped
overall a weak day-I'm done-thanks for coming-see you next week-take some courses
4/21/2023 12:03:16 PM MT Al****:: on secret->esnat72 broke above white level
4/21/2023 12:02:18 PM MT Al****:: rally continues
4/21/2023 11:45:44 AM MT Al****:: Flash Boys bought S1, now crossing pivot, R1 at 4172 possible
4/21/2023 11:41:48 AM MT Al****:: now coming to the Mercury, Uranus, and Moon timelines - getting energy
4/21/2023 11:30:55 AM MT Al****:: here is where CTME says a second round of buying might come in
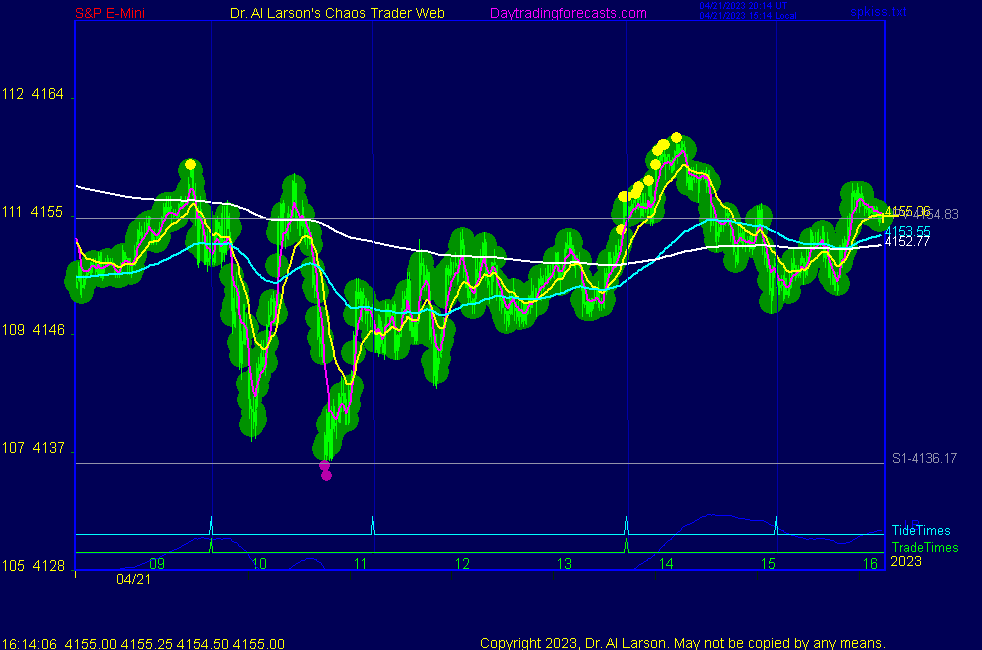
4/21/2023 11:11:09 AM MT Al****:: chart 3 on SPKISS shows 440 minute EXMA turning up
4/21/2023 11:03:33 AM MT Al****:: last minor low was on Mercury +Mh000 electric field flux
4/21/2023 11:01:38 AM MT Al****:: passing solar noon and second vertical line on secret charts - 36/220 still saying up
4/21/2023 10:27:52 AM MT Al****:: chart 3 on SPKISS page has bars colored by a 36 minute crossing a 220 minute EXMA. It is a simple crutch to help one get the direction right. Today it has flipped back and forth. At some point it will stay on color when a decent move occurs. I try to go with it.
4/21/2023 10:14:35 AM MT Al****:: from doing my own homework from the Chaos Trading Made Easy course
I know that if the low near 10:30 holds up, a second wave of buying will come in about 13:10
4/21/2023 10:10:51 AM MT Al****:: an eclipse is formed by the Sun, the Moon, and the Moon's Node
today the Sun and Node timelines are at 13:00 and just after
while the Moon timeline is about 14:20, after the Mercury and Uranus timelines
4/21/2023 10:05:32 AM MT Al****:: this week the solar eclipse has concentrated energy near solar noon at 13:00 Eastern
4/21/2023 10:02:56 AM MT Al****:: the low of the day came as the exchange rotated past Neptune, the planet of illusion
4/21/2023 9:59:26 AM MT Al****:: secret->esnat72 has another vertical line coming up
last minor low was on yellow level, up from the magenta level
support
4/21/2023 9:43:14 AM MT Al****:: support on the whit vibration level on secret->esnat360
and the magenta level / S1 on esnt72
4/21/2023 9:40:56 AM MT Al****:: buzzy and fuzzy
4/21/2023 8:29:26 AM MT Al****:: I have posted a Fractal Of Pi chart in the CCT Room
4/21/2023 8:17:31 AM MT Al****:: there is some support from the up going Moon +T135 electric field flux and the Mercury +Mh000 flux
4/21/2023 8:14:47 AM MT Al****:: early trades on Fridays are often head fakes-this could be one
one handles that by quickly moving stops to break even
4/21/2023 6:46:37 AM MT Al****:: MoonTides do invert, so I focus on the times and use the EXMAs on
chart 3 to sort out direction
4/21/2023 6:43:03 AM MT Al****:: now all the charts on SPKISS are running
chart 1 shows the rally on the red -Tide
4/21/2023 6:36:36 AM MT Al****:: on the Secret->esnat72 chart there is a double bottom on the yellow vibration level, and vertical lines where prices turned up
these vertical lines show times of high energy
4/21/2023 6:24:53 AM MT Al****:: I am running a chart in the CCT Room today
4/21/2023 6:21:52 AM MT Al****:: chart 6 on SPKISS page shows support on the 12 day EXMA
not all the charts on that page are running yet
4/21/2023 6:17:29 AM MT Al****:: early trading suggests the bulls are back
yesterday's late spike low suggested this
this morning's low was higher
4/21/2023 5:21:57 AM MT Al****:: Good Morning visitors. Welcome to the Chaos Clinic.
The written Chaos Clinic is on the AUX page.
This site has a lot of charts,
so you may find it useful to have several of them available within your
browser. If you have a tabbed browser, you can open separate charts
in separate tabs by right clicking on any link, and selecting "open in new tab"
from the menu. The main list of site pages is at
http://daytradingforecasts.com/chartlistsec.asp
Recommended pages to watch are SPKISS, MTRainbow, and Chat.
For astro stuff, add SPSunMoon, Wheel, and Chaos Clinic.
A special set of Dr. Al's research charts are on the Secret page.
Comments in the chat room are announced by a
"duck call" noise. This noise also occurs when the software detects a
resonant hex pattern on the Wheel page. MoonTide trading tutorials
are on the right side of the ListOfCharts page. One should
read Trading the MoonTide Tutorial and Keep it Simple as a minimum.
Many subscribers do not strictly trade the MoonTides, but use the charts on this
site as input to their own trading strategies. For example, charts 5 and 6 on the
SPKiss page are a good starting point for swing traders.
Also on this site is the Certified Chaos Trader's Room. That room is open
to graduates of my 4 main courses. See http://moneytide.com -> Courses for details.
9:00 Eastern-System: No comments
![]()
![]()