
Chaos Clinic Recap
Here are Al's comments
2:59 OK, done for the day; thanks for coming. See you next week
2:57 Ok, uncle; aborting at 35.25
2:49 TG in the chat room is right. The 440 EXMA is still up, bullish
2:44 buying second contract 1337.5 stop 1335; my original entry still viable, average price lowerd to 1338.25
2:39 coming to the exact Tide time. I could have waited, but hindsight is perfect. Winning at trading is ovecoming your harmful tendencies.
2:30 you must realize that you are dealing with illusions. What you think you see is not reality, just evidence for action
2:23 So why am I holding this? Part stubborn, part knowing I often jump early, and no clear proof I'm wrong
If my stop is hit, it's not a big deal. Finally, my FOG pattern suggests a rally soon
2:20 on Fridays especially, if the market holds up past 2:30, it has a tendencey to rally into the close
2:18 still OK
2:12 as I suspected, my entry was early. That's one of my tendencies. Just need to leave the stop set and wait
2:00 updated my FOG chart in the CCT Room
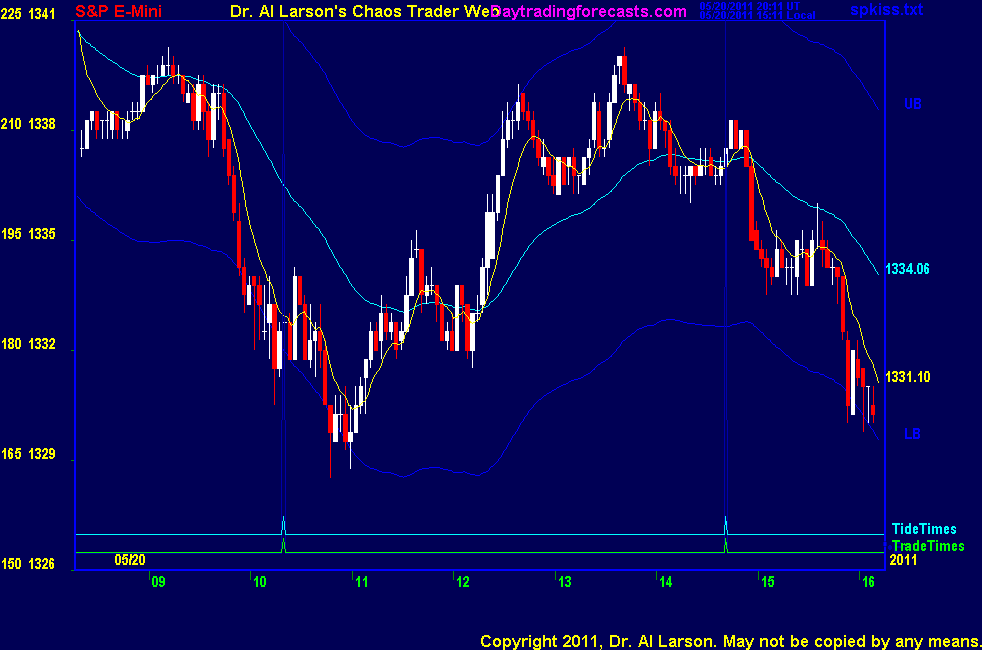
1:54 notice the pattern on the MTRainbow chart. Prices penetrated the 440 EXMA vertically at its low. Then the reaction bottomed on the 440. This is bullish for rest of the day
1:52 I'm probably early here
1:42 the rally is in a move 5 of 7 in an up Chaos Clamshell. I always want to be in move 5, since it is the best mover
1:39 very early for the second trade, but I bought 1339 stop 1335
1:35 holding above 440 EXMA and gaining some momentum
1:25 testing the V,M,R flux again
1:22 updated my FOG chart in the CCT Room again
1:09 updated my FOG chart in the CCT Room
1:04 the last two days we've had a quick drop after the Natural Time just after 2:00, followed by a bounce.
1:00 on the MTRainbow or other two day chart, one could make the case for a 1-2-3-4 down pattern. If so, possible drop
near our trade time
12:52 most day trading techniques teach to cover on a rally that reaches early highs. Looks like that is what is happening
12:40 nice run up to the Venus +V180 flux. Early today it was the last resistance before the drop
12:31 still two hours until next trade; plenty of time to watch
12:27 this is a key point in my down FOP. Watching to see if it turns down soon
12:22 rally up to the white 440 EXMA on the MTRainbow chart; resistance
12:15 stuck on the Uranus +U180 flux. Yesterday's close was on +U225. This is due to the Saturn/Uranus/Pluto/Moon T_Square
12:10 On the MTrainbow chart the flow is down. Looking weaker here.
11:54 This is a very discretionary approach. One should not attempt to use it until one can trade one contract
consistantly well using a simple set of rules like the MoonTide hotline. It takes a lot of practice to get really
good. The basic one is 10,000 hours of focused practice, according to the book,
Outliners, by Malcomb Gladwell. Great graduation gift for high school and college.
11:51 I also use a "You are luck. Get out!" rule. I use a dollar gain of about $500 per 3 or 4 contracts.
Wen I see that sort of gain, I take it and run. If I don't take it, I usually regret it.
11:46 today, I used a small scale version using 2 contracts. My Fog pattern suggested a rally to 1334.5.
I bought one at
1330. It kept looking good, so I added one at 1331.5.
I covered 1334.5. Were I not
doing a Chaos Clinic, I probably would have added many more contracts, but would have limited them to about half the IB limit, just becaus it Friday.
11:36 In my own account, I use a basic money management technique with my patterns. I enter with one contract
when I think I see a good trade setup by the pattern. If the pattern continues to look good after several minutes
I'll add contracts, as long as I don't move my average price too much, somewhere around one point.
If I get a well loaded trade going, I look for a good profit point and get out.
I vary my max loading based on how I've been doing in the last few days, and how sharp I am today.
After any loss, I cut by max load back by 50%. If I'm doing well I will push my load up to the Interactive Broker's limit.
I don't try to demo this on the Chaos Clinic because it requires too much focus to execute.
11:34 Now I'm not at all sad I took my small gain and got out.
11:31 today's pattern is similar to yesterday's- initial decline folloed by a bounce starting on the
11:08 Natural Time. I do trade these if I have a good fit with a FOG or FOP pattern
11:20 updated my FOG chart in the CCT Room
11:17 a 6 point 50% retrace gives 1334.5
11:20 the range today is now one tick under 12 points, 1/6th of the wheel of 72. The earlier hex pattern indicated that
a 6th harmonic was present
11:06 it also suggests a modest rally now up to about 1334.5, yesterday's low on the Sun +H135 electric field flux
11:04 updated my first FOP chart in the CCT Room. It suggests the second trade (14:41) may start a bit early
10:57 guess I could have held for more; but the odds of more were no that good, and I did not want to hold a poor entry
10:55 back from my breakfast break
10:28 I also had a FOG pattern saying this drop was ending; posted it to the CCT Room
10:23 at the exact Tide time; late entry; 9 point range; covering for +1.75
10:15 the one factor that influences me the most, besides the location with in a fractal, is the speed of a move.
fast moves go further; stop to 1334.5
10:05 stop to 1335.5; slow on the entry this morning-doing too much clinic stuff and not enough trading :)
9:56 reconsidered and sold 33.75 stop 36.75
9:54 looks like I may have missed a decent trade; not chasing it
9:39 I have posted a Face Of God (FOG) chart in the CCT room; It suggests this dip is a head fake on the 20/110 EXMA's
9:30 when the EXMA's are flat, they are less reliable. I look at them, but focus on the eMylar ovelay chaos patterns from my four main course.
I find the Face of God pattern and the Fractal of Pi overlayed on a Chaos Trading Made Easy chart to be the most useful.
9:24 I have placed 2 Fractal of Pi charts in the Certified Chaos Trader's Room. That room is open
to graduates of my 4 main courses. See http://moneytide.com -> Courses for details.
9:18 Very quiter pre-outcry. MTRainbow chart shows flat,balanced market. In a sideways contracting triangle.
Trading range will probably be narrow. Trading times 10:20 and 14:41
Just had hex pattern recognized. See hex wheels today and the Hex Whell tutorial, on right side of ListOfCharts page.
This one formed by price, M,V,R and N,C
9:00 Good morning from Chaos Manor
Besides the comments made by Al, the chat room is has live
comments from other traders who sometimes share their views,
trades and tips. Below are the chat room comments from this clinic
5/20/2011 1:00:04 PM MT LEM:: Xover Down; rules say to go short
5/20/2011 12:38:47 PM MT LEM:: I wish he would confirm that.
5/20/2011 12:22:48 PM MT TG****:: I think describing the 440 action as "bearish" was an error. I think Al wanted to say bullish.
5/20/2011 12:22:30 PM MT LEM:: 22ma XOVER down 110ma
5/20/2011 12:19:49 PM MT mm****:: I wondered also
5/20/2011 12:19:30 PM MT LEM:: I fail to see why you are holding the buy for so long. You were so quick to move the stops on the short trade and take profits this AM. Espec since you said the 440MA action is bearish.
5/20/2011 12:02:34 PM MT TG****:: Al, you typed "this is bearish for the rest of the day", you wanted to say "bullish" didn't you.
5/20/2011 11:56:01 AM MT LEM:: I see the V/R/M on the Chaos Clinic on the top right about 1339 level. Does the right side of the chart (Y Axis) then correspond to the aspects re: the $ on the wheel and the bottom of the chart (X axis) relate to time and the X (exchange) on the wheel?
5/20/2011 11:53:02 AM MT LEM:: Is the Venus flux related to the Wheel with the $ in opposition to MVR?
5/20/2011 11:52:14 AM MT mm****:: double top
5/20/2011 9:54:49 AM MT MJ:: Dr. Larson, thanks for your commentary on position size and scaling in. When you say "IB limit" do you mean IB has a maximum position size for 'any' account or are you referring specifically do your own account? For example, if you traded $100K your maximum position size could be approximately 30 contacts.
5/20/2011 9:48:13 AM MT LEM:: Harmonic count now 66; I wonder why the market is not doing much with all this energy...
5/20/2011 7:26:37 AM MT LEM:: I don't think I have seen such a high harmonic count on the wheel before: 56. With the hex pattern accompanying it, can the market stay in a narrow range for long with so much harmonic energy?
5/20/2011 6:19:33 AM MT Al****:: GM all-good luck today
39 F and partly cloudy in Denver
5/20/2011 5:03:40 AM MT mm****:: gm all - have a great day
9:00 Eastern-System: No comments


[ Live Clinics on Friday on DaytradingForecasts.com ]