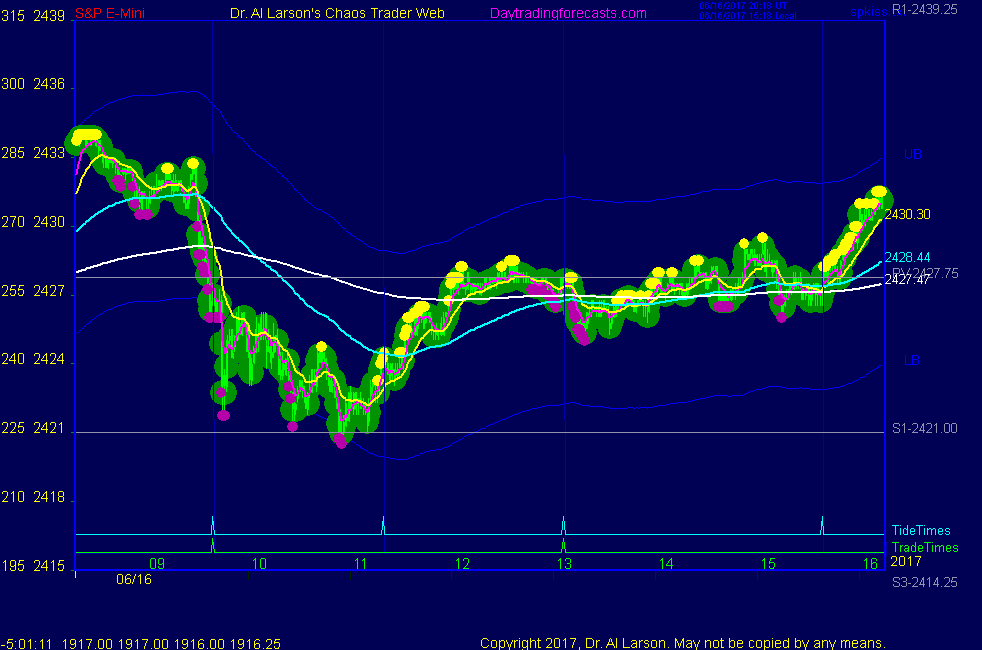


1:16 no clinic next week- I'll be out of town; thanks for coming; take some courses
1:15 OK, that's my two trades - a flat day;
1:13 stopped out for -2.5
1:10 when prices hold up 2 1/2 hours from a low, a second round of buying usually comes in
1:06 at exact Tide time- still OK
12:54 I may have entered too soon but still looks good
12:35 buying 2428.5 stop 2426 - 110 is up, stop below it, no selling by computers at the pivot
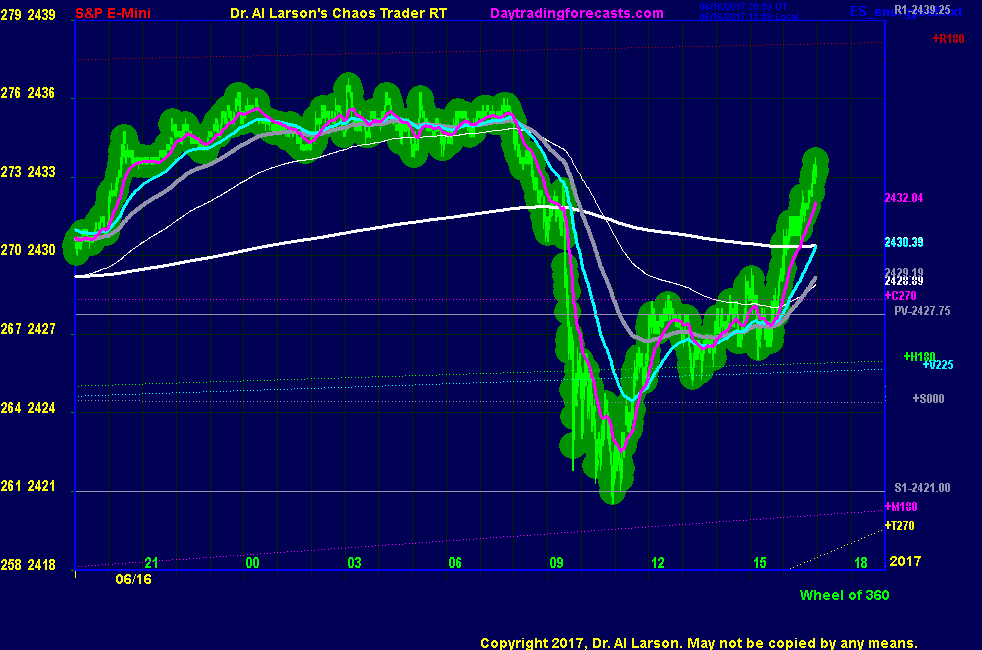
12:31 need to get above the 6 day mean at 2429.87 to get a good rally
12:26 220 minute EXMA is flat and depressing price -
12:23 in second trade window
12:20 rally looks stalled at 40% retrace
12:04 back up to the pivot
11:54 nice little bounce-maybe it will be a second wind near the next trade time
11:40 I have placed that Face Of God chart in the Certified Chaos Trader's Room. That room is open
to graduates of my 4 main courses. See http://moneytide.com -> Courses for details.
eMylar Fractal of Pi overlays help you be patient, since they show you future potential moves.
The best bargain in my courses is to take the Cash In On Chaos and Fractal of Pi courses and
learn to use the FOP overlay. Then take Chaos Trading Made Easy, and finish with Face Of God.
11:35 the "gap up, buy a low at 11:00" was good , but not a hotline trade; can see it with a Face Of God pattern
11:03 low may be in; next trade time is 13:06 ; taking a break for about an hour
10:55 down to s1
10:40 probing for a bottom
10:27 hard for me no to chase this-but discipline means making your trade according to plan and accepting the result
10:23 this was a "gap up" day, with a decline; Often it produces a low near 11:00
10:18 low holding for now
10:08 did not make it down to S1
10:02 I got in, got some, got out so no regrets that I left money on the table
9:52 day's range expanded to 15 points - that may be it
9:47 bigger move than I expected but very fast and hard to trade manually
9:43 I used a close target there because early Friday moves are often head fakes
9:40 this drop retraces about 50% of yesterday's rally; usually attracts buying
9:36 out for +2.5 cancel other orders
9:35 stop to 2430
9:33 moving cover to 2427.5 stop to 2431
9:32 stop 2432
9:31 selling 2430 stop 2433 cover 2428
9:25 trading at 6 day mean-wide white line on my AUX chart
9:20 this is a correction-I expect an A-B-C pattern with A in progress;
9:12 today's 24 hour range is about 6 points - too narrow for good trades
8:53 support for this down move is at the pivot price of 2427.75-9 point range on 3 point quantums is 2427
8:50 this looks like a narrow range pullback day- small profit targets are in order- 2 or 3 points
8:43 Overnight trading rallied 4 points from close, then went flat, and is now selling off a bit.
my chart on the AUX page shows currently following +Tide. Trade times are 9:40 and 13:06
8:20 Good Morning. Welcome to the Chaos Clinic. This site has a lot of charts,
so you may find it useful to have several of them available within your
browser. If you have a tabbed browser, you can open separate charts
in separate tabs by right clicking on any link, and selecting "open in new tab"
from the menu. The main list of site pages is at
http://daytradingforecasts.com/chartlistsec.asp
Recommended pages to watch are SPKISS, MTRainbow, and Chat.
For astro stuff, add SPSunMoonMer, Wheel, and Chaos Clinic.
Chaos clinic comments appear at the bottom of the SPKISS, MTRainbow,
and ChaosClinic pages. Comments in the chat room are announced by a
"duck call" noise. This noise also occurs when the sofware detects a
resonant hex pattern on the Wheel page. Trading tutorials
are on the right side of the ListOfCharts page. One should
read Trading the MoonTide Tutorial and Keep it Simple as a minimum.
9:00 Eastern-System: No comments