Chaos Clinic Recap


Here are Al's comments
********************************************************************************
Solar Eclipse Powers S&P to New High
Chaos Clinic for 7/5/2019
********************************************************************************
This week the S&P futures broke out to a new high, finally reaching the magic 3000
level. While some give credit for this event to hopes for an interest rate cut, I
would suggest the energy came from the July 2nd total solar eclipse.
Traders, especially commodity traders, have long had a fascination with the lunar
and solar eclipses. W. D. Gann and many others have used them as timing tools.
But are their effects real? If one looks at the US stock market and all of the
eclipses over many decades, you will find that some show up clearly as major
turning points, and others seem to have no effect at all. In 1991 I made a study
of eclipses and learned why this is. That study, Trading The Eclipses, is available at Moneytide.com
Besides doing such statistical studies, one can also watch the effect of eclipses
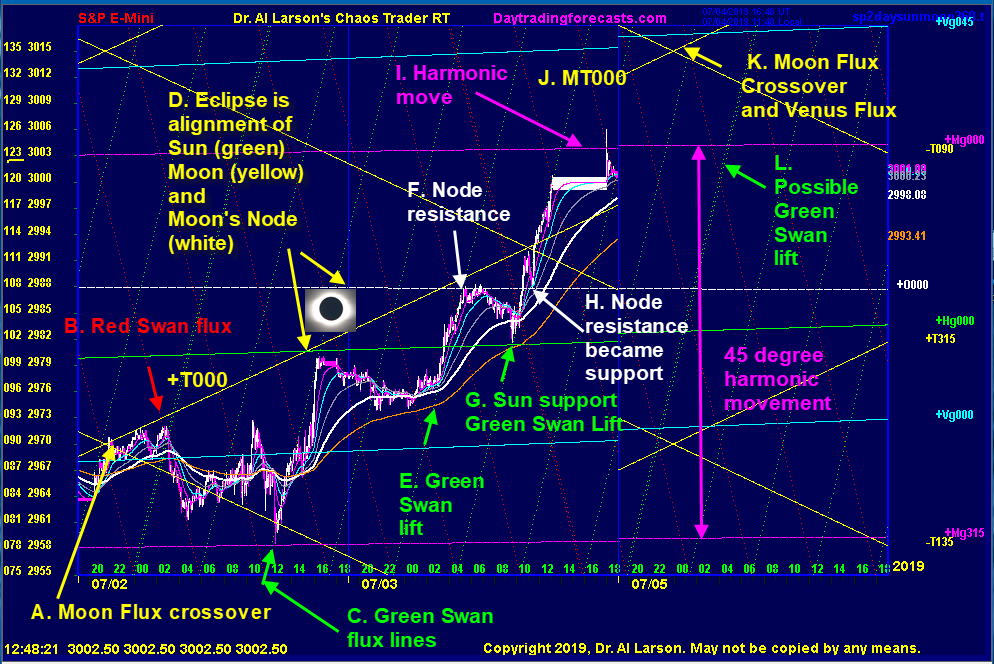
in real time. This chart shows how the July 1, 2019 eclipse showed up in the S&P futures.
This chart shows 3 minute candlesticks of the September ES contract over the last
two trading days. Also plotted on the chart are electric field flux lines for
the geocentric Sun, Moon, Mercury, Venus, and Moon's node. Another set of
much steeper flux lines are shown as Red Swans and Green Swans. These are
electric field versions of Black Swans, and are explained in more detail on my
daytrading site, DayTradingForecasts.com
Eclipses occur when the Sun, Moon, and Moon's Node line up. The alignment of the Node
does not have to be exact, but must occur within several hours of the Sun/Moon alignment.
The difference in the Nodal alignment is what casts the shadow of a solar eclipse at
difference places on the earth. The accuracy of the Moon/Sun alignment is what makes
a partial or total eclipse. The July 2nd eclipse was a total solar eclipse it the
southern hemisphere, most easily viewed from southern Chile.
On this chart I have labeled several events A through L. Two days of 24 hour data are shown,
starting at midnight Universal Time. The hour labels are Eastern Daylight time. At point A, the
negative and positive Moon flux crossed over, very near the Venus electric field flux line.
That created price oscillation, as prices were attracted toward one on the other Moon flux.
Red Swan and Green Swan flux act like winds, trying to tip the energy balance up or down. Sometimes
they "catch" price and move it along the Swan flux. Other times they only have minor effects.
The difference comes from how these energy cycles synchronize with other cycles. Once these
Swans catch, they often set up a rhythm with other Swan flux.
At B, a Red Swan sent prices down for s while, but then the Venus line pulled them back. Then the
negative downward Moon flux pulled prices down to the Mercury flux. There, shown at C, a Green Swan
started prices up. As the eclipse formed (I was watching it online) prices were attracted to
the point where the Moon flux (yellow +T000) and Sun flux (green +Hg000) crossed. That was the
point of total eclipse(D). In Market Chaos Theory, that point was a Strange Attractor/Strange
Repellor.
From there prices sagged during the overnight market until point the Moon approached the Node.
At E a Green Swan fueled the rally up to the Node flux, which became resistance at F. From there,
prices sagged into the early morning lows, down to the Sun flux, where they were caught
by another Green Swan at G. Prices rallied through the Node flux, then pulled back to it
for support. From there it was up until the early close at 1:15 EDT.
As a last hurrah, in the late settlement period prices hit the Mercury flux at I, then retreated.
From the low at C, this was a harmonic 45 point (degree) move, 1/8th of a circle.
Over the 4th of July holiday, the Moon will conjoin Mercury at J. MT000 means Mercury (M)
conjoins (000) Moon (T). Mercury/Moon is the biblical 40 day cycle.
Flux lines can be plotted for any point in time. This chart shows the flux lines for the 5th.
One can expect the joy of breaking 3000 to spill over early in the day. A point to watch would
be K, where there is a Moon flux crossing near the Venus flux. Another point to watch would be
the Green Swan at L. The Sun, Moon, and Mercury flux will be support/resistance levels.
A version of this chart is on DayTradingForecasts as the SPSunMoon chart. Traders can watch it free
on Fridays, and on other days by subscribing to Tomorrow's Market Hotline Emailavailable at Moneytide.com
Traders can plot their own flux lines in NinjaTrader using software from EnergyFieldTrading.com
Besides the comments made by Al, the chat room has live
comments from other traders who sometimes share their views,
trades and tips. Below are the chat room comments from this clinic
7/5/2019 1:45:36 PM MT Al****:: I'm done for the dayh and week. No Clinic next week. Thanks for coming. Take some course. Have a good weekend.
7/5/2019 1:32:31 PM MT Al****:: the rally went up a Green Swan. Only a Red Swan left today
7/5/2019 1:29:22 PM MT Al****:: as MJ pointe4d out, this could well be a Hannula Hook, from the Cash In On Chaos course
7/5/2019 1:14:34 PM MT Al****:: on the SPSunMoon chart the Moon flux which gave support today
pops up over prices to about 3009 on Monday, so I think Monday will be down, but no guarantees.
7/5/2019 1:05:36 PM MT Al****:: now from a longer term prospective, today has a lower low, and a
lower high than the 3rd. That's the very definition of a change in trend. Of course, it may be an illusion, but time will tell.
7/5/2019 12:52:41 PM MT MJ:: That's great AL thats for making it clear
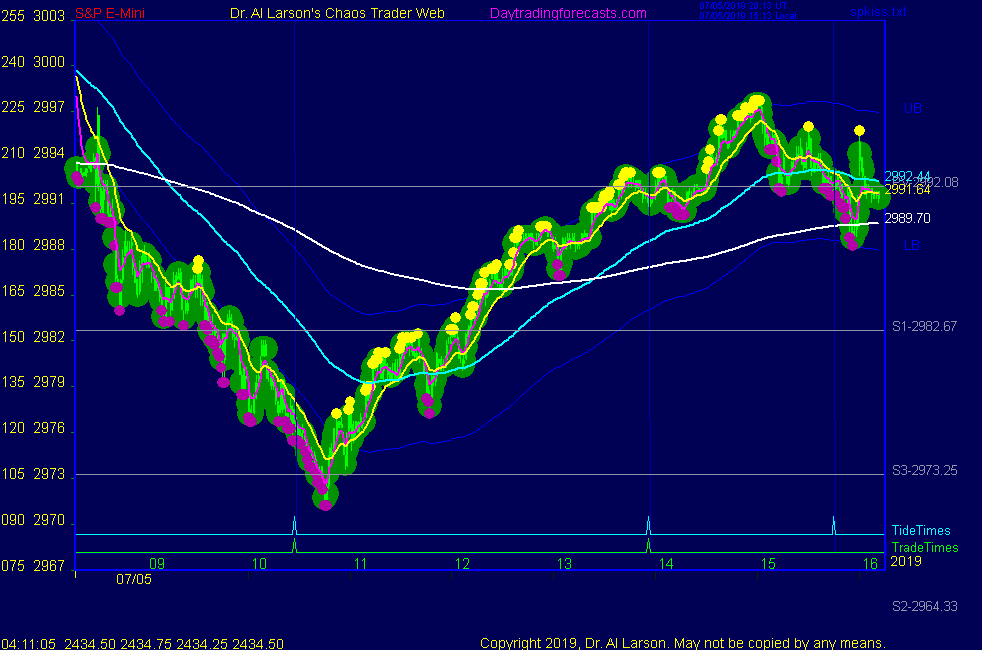
7/5/2019 12:45:32 PM MT Al****:: now, as for the MoonTide daytrade system, just note the colores of the bars on the third chart on the SPKISS page. They are colored by the 20 minute and 110 minute EXMA's. They did give a buy after the first trade time, but have not given a sell for the second trade
7/5/2019 12:42:53 PM MT MJ:: I think the thing is Al is that as its your method we just would like to see how you actually get in especially in a situation like this, where although you suggested the green tide was the one the market pushed up hard instead of falling.
So would this be an inversion and would you trade long?
7/5/2019 12:41:54 PM MT mam:: What u have learnt for years We cannot absorb in few months
7/5/2019 12:36:06 PM MT Al****:: mam: I did demo live trades for many year. They are archived in the Past Chaos Clinics section. I changed to doing a more comprehensive Chaos Clinic last September, because many traders are not day traders, and trade other things. I'd rather teach how markets work, because that is my life's work. There are plenty of people who will tell you to buy or sell. I'd rather see you learn to do it yourself.
7/5/2019 12:19:37 PM MT Al****:: many big players use 30 minute bars , so when they change color,
one can often join them.
7/5/2019 12:17:32 PM MT mam:: AL should show us something to attract us towards his system trading
7/5/2019 12:12:55 PM MT MJ:: Ok Al, I know your method I was just curious to know.
7/5/2019 12:10:42 PM MT Al****:: besides, I am not day trading today, having taken a position very early
7/5/2019 12:08:06 PM MT Al****:: no, you are on your own. I do not call live trades.
7/5/2019 12:05:16 PM MT MJ:: Al you have a turn here can you let us know when you sell?
7/5/2019 11:54:52 AM MT Al****:: Flash Boys sold pivot on news, down to R3, bought there, ran it back up to pivot
that matches the green +Tide
7/5/2019 9:30:20 AM MT MJ:: 1929 is still a very good fit to the current market, it would suggest a sideways period now lasting all month.
7/5/2019 9:10:10 AM MT Al****:: Good point
7/5/2019 8:52:59 AM MT MJ:: First falls in my opinion are never great it usually pops back up. You know that Al you named it the Hanula hook
7/5/2019 8:45:54 AM MT Al****:: FYI I did sell on a position trade, hoping to hold into mid August
Knowing what energy field event turned the market helps my peace of mind. At end of day I will lower stops to break even.
I have noted over the past few months that the broader market, as measured by the Russell is much weaker than the S&P.
7/5/2019 8:42:07 AM MT MJ:: 300 ticks down where do you think it will fall to AL
7/5/2019 7:43:52 AM MT Al****:: lost Sun support; now the eclipse energy is repelling prices lower
7/5/2019 7:23:33 AM MT jvj****:: Good Morning everyone!
7/5/2019 7:19:20 AM MT RR:: GM All.
7/5/2019 7:13:17 AM MT Al****:: 2988 was the Node price of the eclipse-broke that, now touching the Sun. Downturn started on a red Swan before the Employment report
7/5/2019 6:46:06 AM MT Al****:: 3000 is a significant psychological level
7/5/2019 6:45:20 AM MT MJ:: Looking back in history you will see the 3rd or 4th of July is a key reversal period, the market according to some brokers touched 3000 but on some it did not. Usually the pull back is 300 or 400 points. In my humble opinion.
7/5/2019 6:44:31 AM MT Al****:: GM all-good luck today
Chaos Clinic posted on AUX page
Thanks for the post, GON
This is one of the eclipses with the potential to move the market
7/5/2019 6:12:13 AM MT gon:: Al, how do you see this eclipse? A candidate to reverse the market? This would reinforce your the major cycle ZGO forecast down into summer. Also accordingly to your previous posts, ZD36 was basically up into about 5/23 then down into about 8/20, showing a choppy summer sag down into August.
7/5/2019 6:08:15 AM MT gon:: Published: https://www.fxstreet.com/analysis/solar-eclipse-powers-sp-to-new-high-201907051207
9:00 Eastern-System: No comments


[ Live Clinics on Friday on DaytradingForecasts.com ]


