Yes You Can... Cash In On Chaos!

Chaos Clinic Recap


Here are Al's comments
3:39 out flat-done for the day. Thanks for coming. See you next week. Take a course
3:29 I resold after tweeking my FOP pattern. Stubbornly sticking it out
3:22 resold 874 stop 877
3:17 I'm hanging around to see if this thing does break down late
3:15 aborted -1.5; no go
3:04 stop to 876, control my loss
2:55 still hanging fire-needs to move soon
2:40 still OK-both overlays look good. Last hour will tell.
2:25 elected short 872.5 stop 877
2:23 Jude 4 sold, so my stop may get hit soon
2:16 my sell stop is 872.5-leaving it there; if it is hit my protective stop will be 877
2:11 updated my FOG and FOP charts in the CCT room
2:03 I warned that move 4 was a congestion, and could be confusing. They can streatch out and test your patience,
inducing you to do stupid things.
1:56 we just passed the vertical white Node timeline, after making a low on the Node price flux
there is a tendency to make a price to time move like this
1:50 this little move is still within my Fractal of Pi, which is telling me not to buy it
1:42 Markets do not have permanent "equilibrium" points as incorrectly taught in Economics Departments. Since they are
chatic systems, they only have temporary balance points, then chaotic moves to a new balance point.
The bell curve Gausian statistics used by the economists are WRONG. Mandelgrot, inventor of fractal geometry,
showed that the correct stattistics are Paretian. The bell curve becomes a Witch's Hat, with a sharp peak and wide brim-the chatoic tais.
1:31 the MT rainbow chart still shows me 4 moves of 7 in a down Chaos Clamshell
1:27 in between the two trade times, so may not get a move until close to the second one
1:22 raising my sell stop to 872.5
1:13 we also got antother hex pattern, which can hold price still for a bit
1:06 here I'm very wary of the 20 EXMA having crossed the 110, because it ran smack into the 440. So I'm still thinking sell
12:57 last minor low 872-putting a sell stop at 871.5
12:53 energy center is a bit higher, on the J,N,C flux -still waiting, looking to sell a break down
12:45 getting a bit of a rally up to the 440-watching to see where the move stalls
12:36 In a chaotic system, energy moves from one "strange attractor/strange repellor". The Face of God pattern
is a tool to help find these energy points. It is telling me now there is one at about 873, 13:20, acting as an attractor
12:30 Opened gap down, tried to rally, failed, tried to decline, failed, now back to starting point
12:27 the volatility has died down-common as traders take a lunch break
12:11 on the MTRainbow chart, we are below a down sloping 440 EXMA. Here I only shop for a sell. I treat the 440 as
my Yalu River. ( testing your knowledge of warfare :) )
12:08 from yesterday's high, this is a move 4 of 7 in a down Chaos Clamshell. Move 4's are congestions, and can be confusing, so need to wait until they are really over
12:05 making a counter trend rally foing into the first trade window-I want to be patient, and wait until it ends
11:54 I have updated my Fractal of Pi and Face of God charts in the Certified Chaos Trader's room.
11:47 this move found support on the Node (O) electric field flux. Node is hot due to the eclipses
11:32 that autotrader, Jude 4, just took a quick 7 points and covered. That suggests the streak is over. By our first
trade time we hopefully will get another good trade setup.
11:30 Another thing I work on are auto traders -one of my works in progress is shown on the Aux page. It did take this trade.
11:22 this down streak is part of the Fractal of Pi pattern. If I was not doing a Chaos Clinic and just doing the
MoonTide hotline trades, I would have traded it based on the pattern.
11:09 so far my initial Fractal of Pi pattern is still fitting. In my work, I have found that as energy adds together,
it forms patterns. One of these patterns is a Fractal of Pi. While it is mathmatically complex I have simplified it
to a simple pattern overlay to place over a chart. Orignally I used plastic mylar overlays drawn on an inkjet printer,
but in January I created "electronic mylar" overlays, with are standard program windows with a milky tranlucent background
with a pattern on it. These are easily placed over any chart on your screen. It is a great tool.
To see what an "electronic mylar" overlay is, go to https://secure.moneytide.com/secure/moneytide/products.asp
Scroll down to courses, and find the link [ Download Electronic Mylar Overlay Demo ]
That gives you a simple circle overlay to play with
10:59 energy fields form harmonic patterns. Recognizing these can tell you key prices and times. The north eastern
corner of this hex was just after the open, and we got wild action. The north westen corner is near 13:40, a time to watch
10:52 if you have your sound card on, you just heard a "duck call" from the automatic hex pattern recognizer.
On the Wheel of Fortune and Hex Wheels today the pattern is seen to be formed by Mars, Uranus,Node, with J,N,C,T at
the midpoint of a side. This is an unstable hex because of that midpoint.
10:45 Prices have now been attracted back to the Moon T+090/Jupiter/Neptune/Chiron electric field flux bundle.
On the Chaos Clinic chart, the red and green MoonTide lines are flat near this price level, until they "bifurcate" just after 13:00. They are forming a MoonTide Fractal Set pattern.
10:38 If you are new to my work, I suggest you go to http://moneytide.com/hans/index.asp . On that page just under
my mug shot is a link to a talk about my work, given at AEC 2006. I also suggest you go to the Frees Stuff page
and download my free ebook, Your Electric Life. It explains my concept of energy in the universe.
10:18 Dash, splash, trash - stay out
10:13 I have placed two charts in the Certified Chaos Trader's room. It is open to those who have taken my
four main courses if you log in with your last name and use your email as your password
10:08 now on the MTRAinbow chart, again below the white 440 EXMA. The rally faded too fast to really turn it up
so now I would say the trend is flat to down
10:01 that band gap jump was 9 points. It should take about 3 hours to work off, using Gann' squaring of price
and time, with 3 points = 1 hour. That takes us to about the first trade time
9:57 on the Chaos Clinic chart, the fast move went from the Moon -T000 to the Moon -T315 electric field flux
this is a band gap energy jump, just as electrons make inside a transistor
9:55 now I'm watching for a fast fade, to settled down into a congestion zone
9:53 on the MTRainbow chart, this fast move has penetrated the 440 EXMA, turning it flat to up, so trend now flat to up
9:42 I'm expecting this rally to fade, perhaps sooner than 11:00 based on my initial Fractal of Pi on the MTRainbow chart
9:36 the initial run up stopped at the Moon +T090 and Chiron electric field flux as shown on the Chaos Clinic chart
9:31 looking at the MTRainbow chart, the white 440 EXMA is down. It says the trend of the day is down.
It provides resistance an 877. We are starting gap down, which usually means a countertrend rally until about 11:00 
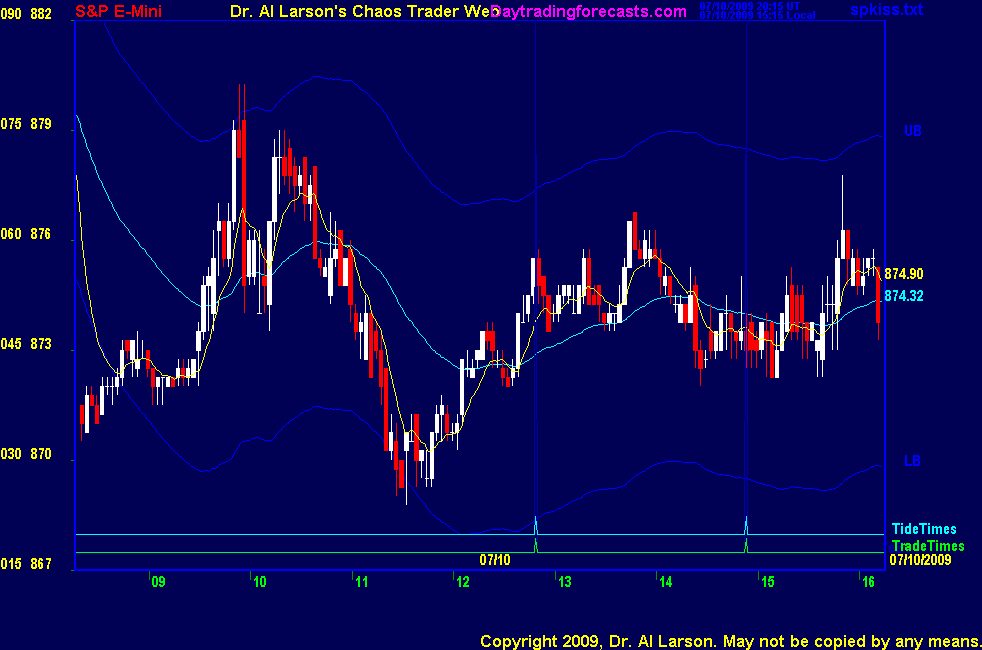
9:29 Today we have a flat MoonTide forecast until the afternoon, with trade times at 12:49 and 14:53
9:00 Good morning from Chaos Manor


Besides the comments made by Al, the chat room is has live
comments from other traders who sometimes share their views,
trades and tips. Below are the chat room comments from this clinic


7/10/2009 2:08:54 PM MT DP****:: Al, Thank you for everything. I always learn from your Friday commentary. Have a great weekend.
7/10/2009 12:23:28 PM MT rrh:: the XGO chart that is sold for S&P would you have a +/-% about how often it follows that --- compared to your StargoS270 --- i know you mentioned on a couple pictures of XGO you moved it up or back 3 days --- would i still need to do that when following S&P XGO if i purchased that? thanks for any info
7/10/2009 9:06:58 AM MT TG****:: Hi Dr Al, I think today is a two moon day, does that change how you view or attempt to trade the daily fractal? Thanks.
7/10/2009 7:58:45 AM MT rrh:: thanks a lot jb exactly what i was looking for
7/10/2009 7:29:33 AM MT jb:: rrh click here and select the date you want to see: http://daytradingforecasts.com/hotsave/hotlinks.asp
7/10/2009 7:26:00 AM MT rrh:: morning all --- is there a place to view this weeks moon tides -- just wanting to see where the moon tides were on the last low a couple days ago thx
7/10/2009 6:08:58 AM MT mm****:: gm all - have a great day

9:00 Eastern-System: No comments


Home Up

[ Live Clinics on Friday on DaytradingForecasts.com ]