
Chaos Clinic Recap
Here are Al's comments
************************************************************************************************
젨젨쟙ill Silver Shine Again?
젨젨잺haos Clinic for 7/26/2019
************************************************************************************************
About a month ago, I couldn't get into my usual barber shop in a timely manner. So I tried a different one.
My barber was about 6 foot 4, 280 pounds of muscle, about 40 years old, and tattooed everywhere I could see.
He looked more like an NFL linebacker than a barber. He asked me how I wanted my hair cut, then
set to work. After a while, he asked me what I did. When I said I traded commodities, he lit up.
He then proceeded to tell me that he was collecting silver. In the next twenty minutes, he told me he
had no debt, owned two houses outright, one for rent, and did not trust the US dollar. He said he
understood that our national debt kept growing, and a devaluation could happen. He told me nearly
all the men whose hair he cut were living on easy credit, driving cars much more expensive than
they should, and none of them seemed worried about the future. He was going to be prepared
for the worst. He was buying silver now because "It is cheap."
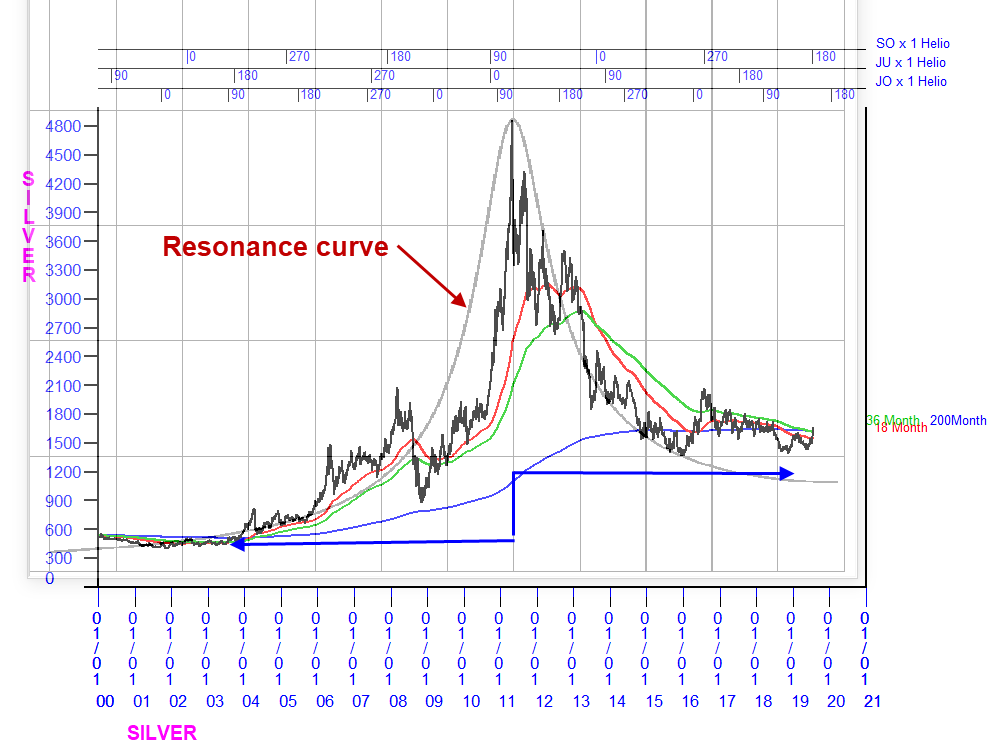
It turns out, he was right, not only that silver is relatively cheap, but that now might be a good time
to accumulate it. This chart shows silver future prices since the turn of the century. It shows
a rally and a decline. So what indicates that it might rally again?
In my work, I try to understand how the electric field affects prices, and why certain patterns
are produced. One of the things I have discovered is that prices can exhibit a "time domain resonance."
Radios work by using resonant circuits to select a particular station by tuning to its transmitting frequency.
When you twist the tuning knob on a radio, you are changing the resonant frequency of the radio,
selecting the station you want. As you tune across a station it gets louder, peaks, then gets quieter.
This is a "frequency domain resonance." Resonant circuits are often explained as electric fly wheels.
Once a flywheel starts spinning, small properly timed strokes can make it spin faster and faster.
In the tuned circuit, the incoming signal peaks are the strokes.
In time domain resonance in a stock or commodity, groups of buyers inject more and more
buying energy as prices rise, then more and more selling energy as prices fall. Surprisingly,
the silver prices on the chart have a reasonable fit to a resonant response curve calculated
for a tuned radio circuit. The base width of the tuned circuit is called it's bandwidth.
In the time domain, it could be called the time bandwidth. This is shown by the two
blue arrows extending left and right from the center of the resonance.
The importance of this is that it suggests that the resonance is effectively ended.
I like to track patterns back to planetary positions, as all the planets are players in
the electric fields that form our plasma universe. At the top of the chart, I have shown
three cycles: JO-Jupiter/Node, JU-Jupiter/Uranus, and SO-Saturn/Node. The quarter
cycle points are marked. Near the resonant peak, The cycle points line up closely.
Going to the left and to the right, the alignments slip further and further apart.
The energies synchronize closest at the resonant peak. The time bandwidth
is effectively two Jupiter/Node cycles, measured at the 90 degree points.
This is just over one Jupiter/Uranus cycle, measured at the 180 degree points.
In this case, there is about a 4 month delay from the planetary resonance to the price
resonance. Most physical systems have such a delay from input to output.
This delay is due to the internal processing time of the system.
What this model shows is that the whole resonant phenomenon is complete,
so a strategy of accumulating silver is reasonable. On the chart are three
exponential moving averages; a blue 200 month, a green 36 month, and a
red 18 month. These averages are now converging. When the 18 and
36 turn up and cross, they will give a buy signal. One can also use
a dollar cost average technique to begin accumulating silver now.
At a regular interval invest a fixed dollar amount. You buy more shares on
the dips. This can be done using an Exchange Traded Fund, such as the iShares SLV.
For more on my work, see Moneytide.com
Besides the comments made by Al, the chat room has live
comments from other traders who sometimes share their views,
trades and tips. Below are the chat room comments from this clinic
7/26/2019 2:05:20 PM MT da:: test
7/26/2019 12:05:19 PM MT TED:: Thanks, Al!
7/26/2019 11:53:20 AM MT Nella****:: thanks, Al. Nice trade. Have a good weekend.
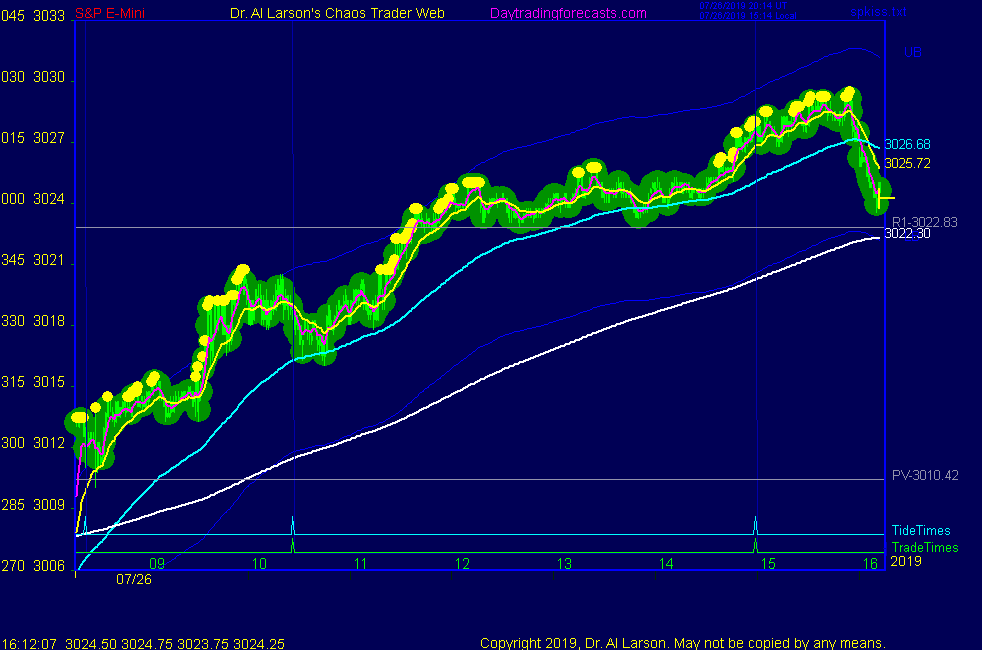
7/26/2019 11:51:31 AM MT Al****:: I covered for +6 on the stall. There may be more, but I'm done for the day and the week. Thanks for coming. See you next week. Take some courses.
7/26/2019 11:38:09 AM MT Al****:: until about 10:30 prices followed the red -Tide, then switched
to the green +Tide. Could end the day with a switch back to red
on second trade time
7/26/2019 11:33:38 AM MT Al****:: not exactly a barn burner, but pressure is still up
7/26/2019 11:23:22 AM MT Al****:: eased my stop up to 3021.5, locking 4.25
7/26/2019 11:11:07 AM MT Al****:: I have placed a Chaos Trading Made Easy chart in the Certified Chaos Trader's Room, from the course by that name. The CCT room is open
to graduates of my 4 main courses. See http://moneytide.com -> Courses for details.
eMylar Fractal of Pi overlays help you be patient, since they show you future potential moves.
The best bargain in my courses is to take the Cash In On Chaos and Fractal of Pi courses and
learn to use the FOP overlay. Then take Chaos Trading Made Easy, and finish with Face Of God.
7/26/2019 11:00:16 AM MT Al****:: eased my stop up to 3020.5, have sell limit at 3035
7/26/2019 10:46:42 AM MT Al****:: no selling at R1. SPSunMoon chart shows cluster of timelines here. I think prices move higher after the solar noon at 13:00
7/26/2019 10:19:32 AM MT Al****:: I have now moved my stop to 3019.50, locking 2.25 points
7/26/2019 10:13:12 AM MT Al****:: on the MTRainbow page you see a clear divergence of the EXMAs.
Check it out, and read the explanation Trading The MoonTide Rainbow.
7/26/2019 9:59:46 AM MT Al****:: moves from magenta star bursts can go to the next star burst 45 points lower or higher-not necessarily on the same day
7/26/2019 9:45:00 AM MT Al****:: For newcomers, welcome to the Chaos Clinic.
The written Chaos Clinic is posted on the AUX page.
This site has a lot of charts,
so you may find it useful to have several of them available within your
browser. If you have a tabbed browser, you can open separate charts
in separate tabs by right clicking on any link, and selecting "open in new tab"
from the menu. The main list of site pages is at
http://daytradingforecasts.com/chartlistsec.asp
Recommended pages to watch are SPKISS, MTRainbow, and Chat.
For astro stuff, add SPSunMoon, Wheel, and Chaos Clinic.
Chaos clinic comments appear at the bottom of the SPKISS, MTRainbow,
and ChaosClinic pages. Comments in the chat room are announced by a
"duck call" noise. This noise also occurs when the sofware detects a
resonant hex pattern on the Wheel page. Trading tutorials
are on the right side of the ListOfCharts page. One should
read Trading the MoonTide Tutorial and Keep it Simple as a minimum.
7/26/2019 9:43:29 AM MT Al****:: that trade is also clear on the Chaos clinic page
7/26/2019 9:42:03 AM MT Al****:: on the third chart on the SPKISS page there was a clear 20/110 EXMA continuation buy at the first trade time. I did buy 3017.25
7/26/2019 9:40:39 AM MT mj:: Thanks Al for explaining
7/26/2019 9:37:00 AM MT Al****:: in chaotic systems, there are strange attractors/strange reactors. That magenta star burst on the Secret->Daniel chart
is one such SA/SR. It could have turned prices down, or up.
Once prices got above the center of the starburst, it pushed prices up.
7/26/2019 9:18:19 AM MT Al****:: I think we are seeing a rally of hope up into the Fed meeting-up, but sluggish
7/26/2019 9:13:45 AM MT mj:: Yes sorry I miscounted
7/26/2019 9:08:45 AM MT Al****:: you must mean the 29th?
7/26/2019 9:05:34 AM MT mj:: What's your thoughts on Monday 28th Al?
7/26/2019 8:57:08 AM MT Al****:: we did get lower prices last week, with a dramatic drop late last Friday. Longer term I think we will see lower prices. But for today, R3 is a possibility.
7/26/2019 8:48:09 AM MT mj:: According to my analysis the SP500 is now in a down phase that will last until the 30th/31 July. Then expect a move up. So its a sell the tops method for me.
7/26/2019 8:37:31 AM MT jvj****:: Good Morning Everyone.
7/26/2019 8:31:25 AM MT mj:: AL last week you were calling for lower prices this week you are saying we could hit R3. I am confused, you seem to change your forecast. Why is this surely the forecast is valid otherwise why make it in the first place.
7/26/2019 8:05:53 AM MT mj:: I think the market will fall due to the large volume and the high churn we are now seeing plus the fact we are in a supply area might just hit R1.
7/26/2019 7:56:29 AM MT Al****:: Flash Boy computers bought the pivot, may pause at R1, probably make R3; Pit prices are on SP1Day page
7/26/2019 7:49:25 AM MT Al****:: note magenta star burst on Secret->Daniel chart -now acting to repel prices upward
7/26/2019 7:45:06 AM MT Nella****:: GM everyone
7/26/2019 7:24:23 AM MT Ted:: Good morning!
7/26/2019 4:46:01 AM MT Al****:: GM all. Good luck today. The Chaos Clinic is posted on the AUX page.
9:00 Eastern-System: No comments


[ Live Clinics on Friday on DaytradingForecasts.com ]