2:15 sold 1098 stop 1101 -continuation sell
2:13 this is a good setup-20 and 110 pinched-watch to see if 20 crosses 110 or falls back
2:08 the trend remains down, so this may give a continuation sell setup
2:02 I'm almost at the next Tide turn time-by rule I should cover-so covering for +.25
1:50 testing the lows set by Venus
1:46 now getting some good separation between the 110, 20, and price -a little fan pattern
1:40 stop 1099.50 - general pattern is red -Tide
1:37 stop 1100-above the 110 EXMA
1:32 there it broke it-sold 1098.25 stop 1101.25
1:27 that little move did not break the 12:00 low -prices both side of a flat 110 EXMA
1:18 I want to be careful here not to over trade -market just treading water
1:15 now getting sell coming out of the Tide turn time-watching for follow through
1:06 covering on stall rule -1
12:58 stop 1099.25 -be patient
12:47 so far OK but not impressive-trend is up-sit tight
12:35 bought 1101.25 stop 1098.25
12:29 now got a move that should bend the EXMA's up-looking for a buy entry
12:24 EXMA's flat and twisted - common mid day
12:12 going into the next Tide turn- 110 EXMA dipped, now up slightly-waiting
12:04 low right on it-a 5 or 6 hour fractal of Pi pattern fits so far-says up
12:00 down into Moon/Chiron timeline
11:52 the Moon Chiron energy is only part of the total energy-added togeter they form a
fracal pattern-taught in the Cahsi In On Chaos course and the Fractal of Pi Course
11:42 one needs to get away from the screen periodically-other wise you get mesmerized
MoonTides help with this becasue you know the next trade time
11:23 out +1 - now take a break -back in 20 minutes
11:15 at Moon/Chiron price-stop 1101
11:12 stop 1100.5 -to rally it cannot drop below the 1101 yellow grid crosssing
11:02 stop 1100 -note how it "center punched" the yellow grid crossing
10:58 stop 1099 -make it free or out
10:55 stop 1099.5- right at forecast Tide time, so want it tight
10:51 can press stop fast on a streak-stop 1099
two good guides are to trail by no more than 3 points, or put stop midway between the 20 and the 110 EXMA
10:48 bought 1100 stop 1097-20/110 EXMA buy and mild pullback
10:45 looks like up into the Moon/Chiron time and price point
10:38 my clue to abort there was prices moved above the 110 EXMA in a fast move
that abort saved me 1.5 points of loss on a losing trade
10:37 one key to good statistics is to quickly abort any trade that does not move well
10:35 aborting -1.5 -not working-can retry later if warranted
10:31 trade still OK-any trade may fail-what matters is the statistics over time
note how the 110 EXMa is starting to track along the yellow down MoonTide Harmonic grid line
10:21 sold 1097 stop 1100
10:19 here the 20 EXMA is staying under the 110 EXMA - so watching for a sell
10:14 no rollover-staying flat- first trade near 10:50 but could come early so be alert
10:12 now starting to look like it could roll over-have 20/110 sell crossing, but need some action
10:06 now streak down the blue Venus timeline - can only see this detail on one minute charts
10:02 now perking up on 10:00 resonanct streak-Sun is hot due to squaring Node
this makes 10:00 hot, since 3 hours = 1/8 day away from the Sun
10:01 the 110 and 20 EXMA's are flat - very flat -1098 is a Chaos Balance price
9:58 having a minor server problem-little blip up passing Pluto timeline
9:38 very quite opening -looks to be on green +Tide
9:22 market down a bit on weak GDP report-see Economic News link on List of Charts page
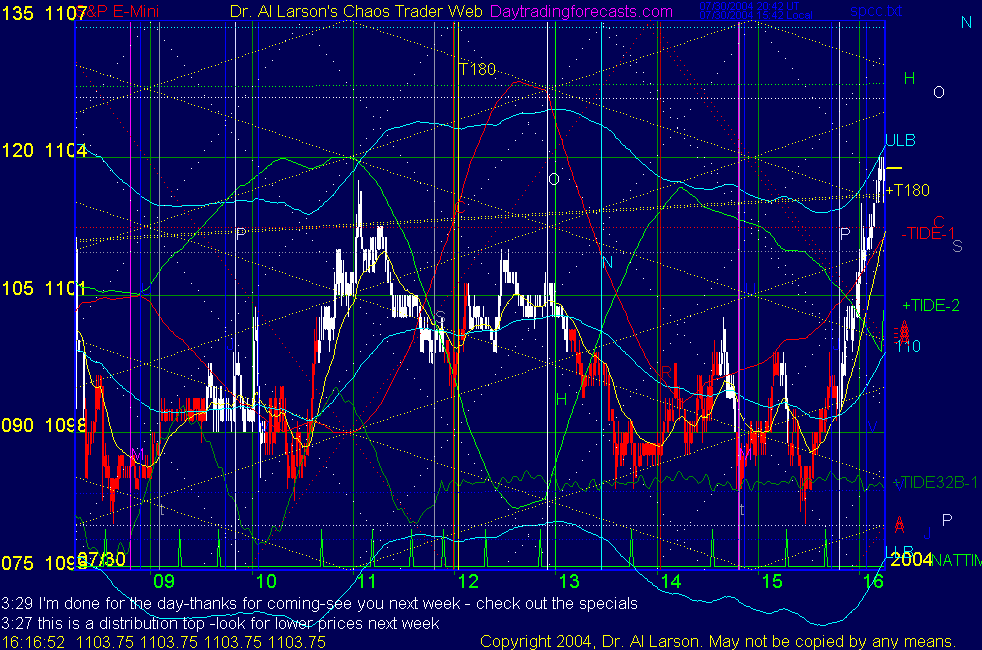
9:05 Yesterday's high was set by Chiron-today the Moon conjoins Chiron-
on the DAX chart you can see prices attracted to the Moon/Chiron electric field flux
9:00 Good morning from Chaos Manor
Besides the comments made by Al, the chat room is has live
comments from other traders who sometimes share their views,
trades and tips. Below are the chat room comments from this clinic
9:00 Eastern-System: No comments


[ Live Clinics on Friday on DaytradingForecasts.com ]