![]()
![]()
********************************************************************************
Longer Term View Of Gold
Chaos Clinic For 8/9/2024
********************************************************************************
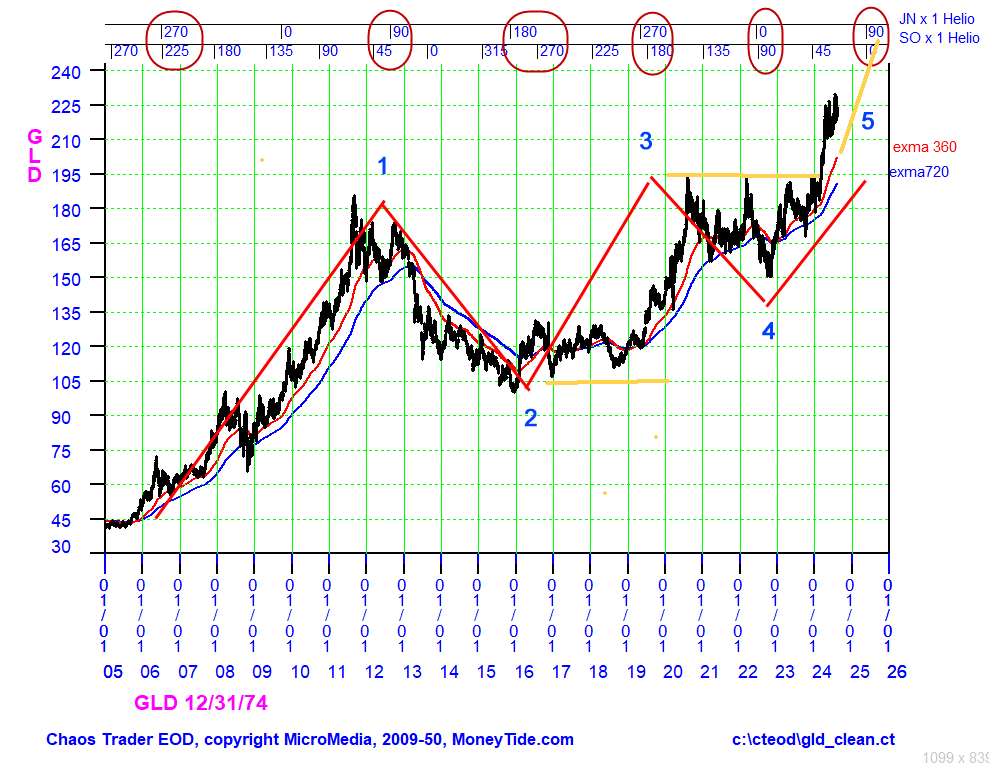
This is a chart of the gold EFT GLD over 20 years. Gold has a pair
of longer term cycles that synchronize to produce the major swings.
The longest of these is the Jupiter-Neptune cycle of 4668.6451 days,
or 12.781years. The shorter is the Saturn-Node cycle of 4166.0125 days,
or 11.405 years, The key aspects of these cycles are shown on the
time lines at the top of the chart. The aspects that synchronized
in gold are circled.
The red line shows the combined cycle. I have added possible Chaos
Clamshell move numbers. Move 1 was 180 degrees, the others are 90 degrees.
That leads us to the current move 5. It should run into mid 2025.
It broke out midway in the move at SO 45 degrees, breaking above
195. Prices have separated from the 360 and 720 day EXMAs.
This is a sign of an accelerating move.
Looking at 3 to 4 to this breakout, one sees an inverted head and shoulders.
A standard projection of the break out would suggest a 240 target.
Taking 2 to 3 as leg A, and 3 to 4 as leg B, as an ABC zigzag,
a C=A projection also gives 240 as a target. I think this is
conservative, in that move 5 of a Chaos Clamshell is usually the largest.
Taking move 5 equal to move 1 gives 285.
Traders should look to buy any dips, and track the move with EXMAs.
I would use the 360 as and outer one, and add 180, 90, 45, and 22,5
day EXMAs.
For more on my work and to subscribe to Tomorrow's Market Email Hotline and access to daytradingforecasts.com see
Moneytide.com
Software to plot electric field flux lines in NinjaTrader is available at
energyfieldtrading.com
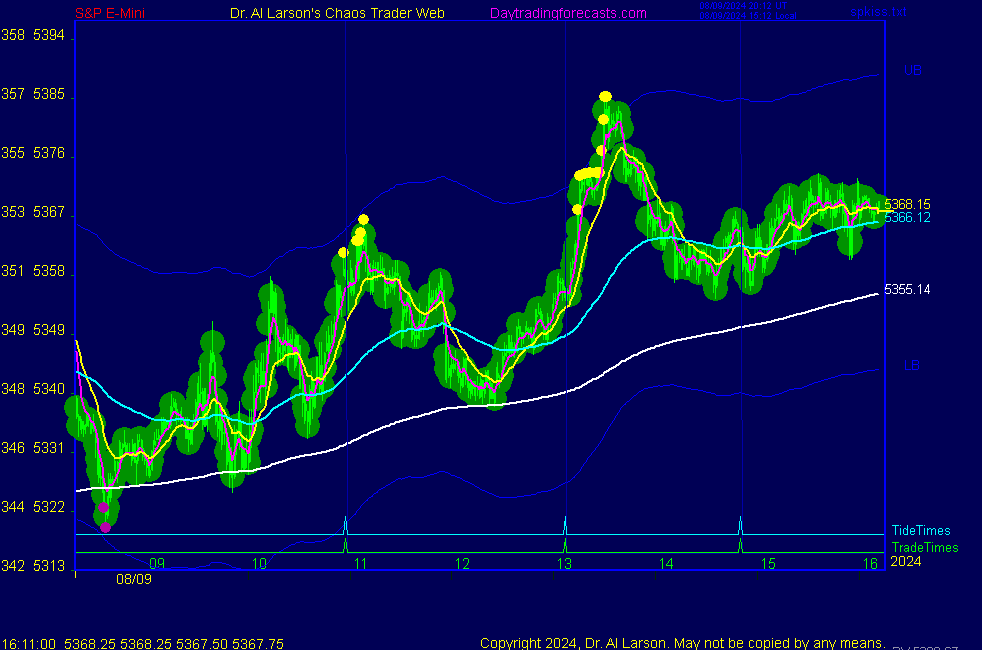
8/9/2024 12:12:43 PM MT Al****:: from here I think we are flat to down. I'm done for the day and week. No clinic next week. Thanks for coming. Take some courses.
8/9/2024 11:47:31 AM MT Al****:: from the low we see 7 swings up
36/220 colored bars up on each of the MoonTide trade time
last rally went from Moon -T225 to -T180 electric field flux line, so high could be in
8/9/2024 8:10:15 AM MT Al****:: I have placed a Face Of God chart in the CCT Room
8/9/2024 6:49:58 AM MT Al****:: Good Morning visitors. Welcome to the Chaos Clinic.
The written Chaos Clinic is on the AUX page.
This site has a lot of charts,
so you may find it useful to have several of them available within your
browser. If you have a tabbed browser, you can open separate charts
in separate tabs by right clicking on any link, and selecting "open in new tab"
from the menu. The main list of site pages is at
http://daytradingforecasts.com/chartlistsec.asp
Recommended pages to watch are SPKISS, MTRainbow, and Chat.
For astro stuff, add SPSunMoon, Wheel, and Chaos Clinic.
A special set of Dr. Al's research charts are on the Secret page.
Comments in the chat room are announced by a
"duck call" noise. This noise also occurs when the software detects a
resonant hex pattern on the Wheel page. MoonTide trading tutorials
are on the right side of the ListOfCharts page. One should
read Trading the MoonTide Tutorial and Keep it Simple as a minimum.
Many subscribers do not strictly trade the MoonTides, but use the charts on this
site as input to their own trading strategies. For example, charts 5 and 6 on the
SPKiss page are a good starting point for swing traders.
Also on this site is the Certified Chaos Trader's Room. That room is open
to graduates of my 4 main courses. See http://moneytide.com -> Courses for details.
8/9/2024 5:31:09 AM MT oag****:: Good morning everyone! Hope everyone has a prosperous day!
9:00 Eastern-System: No comments
![]()
![]()