
11:35 I'm going to quit for the day; The juice is gone, and so is my stamina; thanks for coming. Take some courses.
See you next week.
11:28 if you look at the SPSunMoonMer chart you can see flux lines and timeline interacting to form this converging triangle. All price movement can be tracked down to a PHYSICAL cause if you have the tools, training, and talent.
11:23 if this low hold up, we will have a horizontal converging triangle pattern for the rest of the day
11:19 again my Chaos Trading Made Easy chart is suggesting a timely exit from any short
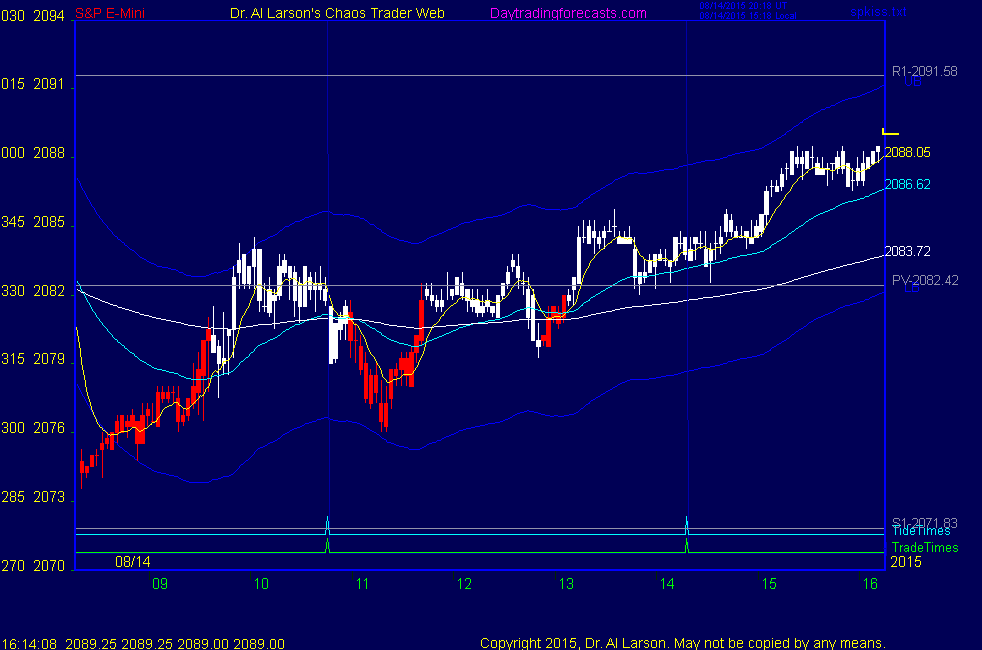
11:14 back for a bit-did get a reversal at the first Tide Time. A reasonable sell would have been about 2080. Given the inside day and the behavior of the rally a 3 or 4 point target would be reasonable.
10:50 going to take a break now; my eyes are tired, having a problem in my right eye from a "vitreous detachment.'
10:41 coming into the exact Tide time the 20 minute EXMA is flat along the pivot price; since I took this trade
going into the Tide time, I would cover here if I were still in
10:35 now as we come into the first Tide time, the momentum is waning; I expect the EXMAs to flatten out,
making the rest of the day a sideways congestion, typical of "inside" days
10:32 I jumped in early because on my 24 hour charts I could see prices were following the -Tide
10:30 that chart is what told me to give up my dream of making 9 points and take my profit
10:29 I have placed a Chaos Trading Made Easy chart in the Certified Chaos Trader's Room. That room is open
to graduates of my 4 main courses. See http://moneytide.com -> Courses for details.
eMylar Fractal of Pi overlays help you be patient, since they show you future potential moves.
The best bargain in my courses is to take the Cash In On Chaos and Fractal of Pi courses and
learn to use the FOP overlay. Then take Chaos Trading Made Easy, and finish with Face Of God.
10:15 an example of flux lines is shown on the AUX page, where I am showing a research chart. This research
is trying to isolate the fewest number of flux lines one needs to use for day trading the eMini.
10:07 it helped me on that trade that I had a good Face of God pattern and a good Chaos Trading made Easy chart
as well as the SPKiss chart. I trade the invisible electric energy fields, so having good tools really helps.
An additional tool is the electric field flux lines, which we are working to bring to NinjaTrader soon.
10:04 I think the rally will peak soon; I got a piece so I just thank God and take it
10:01 I'm a devout coward on Friday early trades; historically they are often head fakes
9:58 taking 4.5 ; losing juice at pivot
9:55 stop to 2081, lock 3; lowering cover to 2086
9:54 stop to 2080, lock 2
9:51 stop to 2079, lock 1 ; up to the pivot price, where the Flash Boys can turn it fast
9:49 stop to 2078, break even; cover limit order at 2087
9:44 looking good, will try to hold for more than 5
9:43 still Ok
9:39 stop to 2077, risk 1
9:37 curling the 220 and 440 upward-strong move
9:36 stop to 2074, risk 2
9:34 stop to 2075, limit loss to 3 points
9:28 look to be getting that, and 110 is curling up; early, but buying 2078, stop 2073 for now; for a trade into the TideTime
9:24 on a "gap down" on my two day time spliced charts, often get a rally into 11:00
9:19 below I have support at 2073 and the S1 price of 2072
9:08 on the SPKiss chart the 20 and 55 minute EXMA's are up, and XTide shows an up energy pulse just
after the outcry open, so we may see a run up to the pivot price of 2082.5
The 440 and 220 EXMA are near 2081 and should be resistance
9:03 It looks like we will probably be trading inside yesterday's range, so trading may not be that good
9:00 today's trade times are 10:46 and 14:18
8:57 Good Morning. Welcome to the Chaos Clinic. This site has a lot of charts,
so you may find it useful to have several of them available within your
browser. If you have a tabbed browser, you can open separate charts
in separate tabs by right clicking on any link, and selecting "open in new tab"
from the menu. The main list of site pages is at
http://daytradingforecasts.com/chartlistsec.asp
Recommended pages to watch are SPKISS, MTRainbow, and Chat.
For astro stuff, add SPSunMoonMer, Wheel, and Chaos Clinic.
Chaos clinic comments appear at the bottom of the SPKISS, MTRainbow,
and ChaosClinic pages. Comments in the chat room are announced by a
"duck call" noise. This noise also occurs when the sofware detects a
resonant hex pattern on the Wheel page. Trading tutorials
are on the right side of the ListOfCharts page. One should
read Trading the MoonTide Tutorial and Keep it Simple as a minimum.
Then where you are in a 7 move Chaos Clamshell matters, if you can figure that out. The clamshell has 7 moves, with 3 continuations and one reversal, so odds are 3:1 for a continuation
8/14/2015 8:26:22 AM MT DPP****:: Hi Al; Thanks for teaching on Friday's; Can you elaborate on how you use trading rules / guidelines for continuation vs. reversal trades at your trade times? Thanks.
8/14/2015 6:11:02 AM MT mm****:: gm all - have a great day
9:00 Eastern-System: No comments
![]()
![]()