![]()
![]()
********************************************************************************
Megaphone Top In S&P
Chaos Clinic For 8/23/2024
********************************************************************************
Since 8/3/2024 the S&P has rallied strongly, gaining about 540 points in 18 calendar days,
That is 3/2 of a circle in 1/20 of a year. That rally looks to have topped.
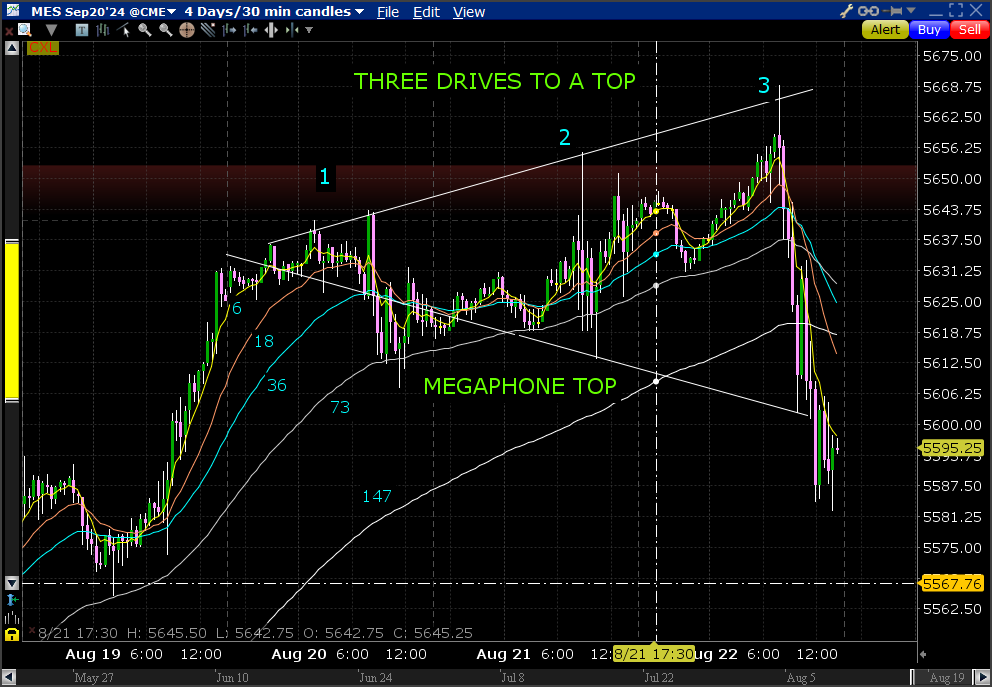
This chart shows the past 4 days of trading. It is a 30 minute bar chart with a rainbow
of EXMAs. The longest is 147 bars, or 73.5 hours, The 73 bar is 36.5 hours, close to 1.5 days,
The 6 bar is 3 hours, 1/8 of a day. This rainbow of EXMAs is useful for swing trading.
One can see how strong a move is by watching how the EXMAs move with respect to one another.
On Monday the 19th, all the EXMAs turned up, and prices rallied smoothly above the 6 bar EXMA.
On Tuesday, the 6, 18, and 36 turned down, bottoming on the 73 bar. This said the rally was
weakening, but not over. That day even had a small "3 drives to a top."
On Wednesday the 6, 18, and 36 EXMAs were entangled. It also included a spike up, and one down.
Yet the 73 bar EXMA supported the pattern. By the end of the day it was clear that on Thursday
the pattern was subject to change. First, there was a closely watched jobless claims report at
8:30 Eastern. Then there was a possibility of a "Two Moon Day", with the Moon T090 timeline
near 9:46 Eastern and the T180 timeline near 15:48. Two Moon days are often volatile and one
way. This one also had the Moon conjoining it's Node within a 3 minute window. This adds strength
to the Moon's cycle, because the Moon is in the ecliptic plane.
On Thursday, the market ran up to the 8:30 report. It sold off briefly, then rallied into the normal
session open, That rally ran up to the line on the chart connecting the highs of the three days,
an obvious "Three Drives To A Top." Then the Moon cycle set the top on the T090 timeline,
and the EXMAs all turned down. The possible Two Moon Day was happening.
As Thursday progressed, there were rallies, which faded, The final daily low was on the Moon T180 timeline,
completing a 7 move down Chaos Clamshell. This slide broke through the lower support line shown.
This completes a Megaphone Top pattern,
The last S&P decline lasted 16 trading days. This top suggests a similar decline. The decline can be
tracked using the EXMA rainbow on this chart.
For more on my work and to subscribe to Tomorrow's Market Email Hotline and access to daytradingforecasts.com see
Moneytide.com
Software to plot electric field flux lines in NinjaTrader is available at
energyfieldtrading.com
8/23/2024 12:22:47 PM MT Al****:: gotten dull-I'm done for the day-no clinic next week due to vacation
thanks for coming see you in two weeks -take some courses
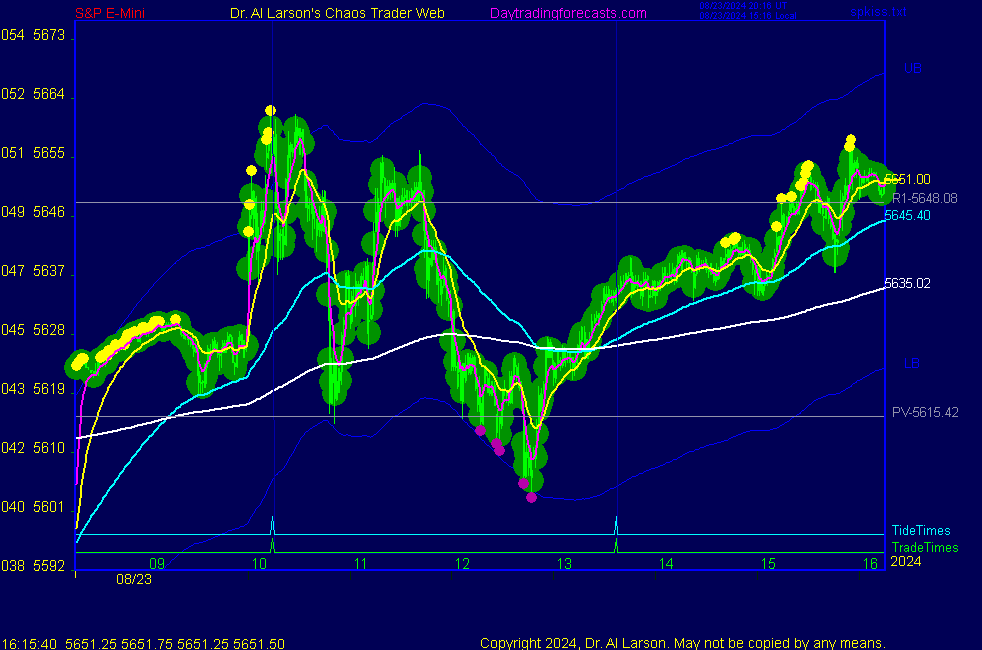
8/23/2024 10:01:15 AM MT Al****:: the secondary high was stopped by the Mercury +Mh270 electric field flux line
8/23/2024 9:59:45 AM MT Al****:: lower intraday high suggests Powell Pump and Dump
8/23/2024 8:48:38 AM MT Al****:: that Powell Pump failed to take out yesterday's high
8/23/2024 6:55:15 AM MT Al****:: Good Morning visitors. Welcome to the Chaos Clinic.
The written Chaos Clinic is on the AUX page.
This site has a lot of charts,
so you may find it useful to have several of them available within your
browser. If you have a tabbed browser, you can open separate charts
in separate tabs by right clicking on any link, and selecting "open in new tab"
from the menu. The main list of site pages is at
http://daytradingforecasts.com/chartlistsec.asp
Recommended pages to watch are SPKISS, MTRainbow, and Chat.
For astro stuff, add SPSunMoon, Wheel, and Chaos Clinic.
A special set of Dr. Al's research charts are on the Secret page.
Comments in the chat room are announced by a
"duck call" noise. This noise also occurs when the software detects a
resonant hex pattern on the Wheel page. MoonTide trading tutorials
are on the right side of the ListOfCharts page. One should
read Trading the MoonTide Tutorial and Keep it Simple as a minimum.
Many subscribers do not strictly trade the MoonTides, but use the charts on this
site as input to their own trading strategies. For example, charts 5 and 6 on the
SPKiss page are a good starting point for swing traders.
Also on this site is the Certified Chaos Trader's Room. That room is open
to graduates of my 4 main courses. See http://moneytide.com -> Courses for details.
8/23/2024 5:28:34 AM MT oag****:: Good morning everyone! Hope everyone has a prosperous day!
9:00 Eastern-System: No comments
![]()
![]()