![]()
![]()
********************************************************************************
S&P Top On Daily Chart
Chaos Clinic For 9/6/2024
********************************************************************************
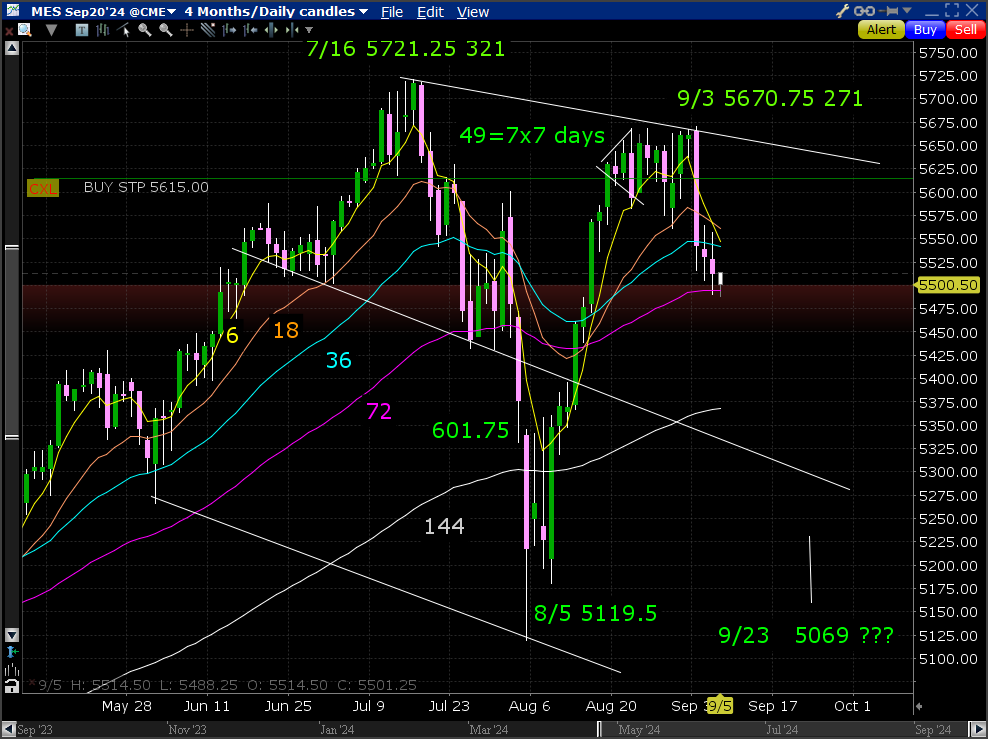
This chart shows 4 months of daily S&P futures.
The all time high came on July 17th. Then the S&P dropped over 600 points
into an early August low. Then it rallied into the last week of August.
There it stalled, trying to push higher. On the intraday chart it made
a megaphone top.
After the Labor Day weekend, on 9/3, prices dropped sharply. The two days since have
been weak. Interestingly, the lower high is 49 days from the all time high.
W. D. Gann used 7x7=49 days cd \map1as a time cycle.
The secondary high was 50.5 points lower than the all time high.That suggests a
349.3 day cycle. That's very close to 7x7x7=343. Interesting, since the
Chaos Clamshell has 7 moves. The eclipse cycle is 346.633 days.
The chart has EXMAs from 6 to 144 days. Note the 6, 18, and 36 day have all turned
down under the secondary high. This shows weakness.
September is typically a weak month in the market. So it is possible that another 600 point
drop could occur. If the resulting low is 49 days from 8/5 it would be 9/23. We shall see.
For more on my work and to subscribe to Tomorrow's Market Email Hotline and access to daytradingforecasts.com see
Moneytide.com
Software to plot electric field flux lines in NinjaTrader is available at
energyfieldtrading.com
9/6/2024 2:13:21 PM MT qq:: 2 minutes after the close there's a price bar jump on SPY from 540.08 to 542.91. That might be a starting mark for early Monday AM folowed by more down.
9/6/2024 12:12:55 PM MT Al****:: prices have gotten dull-hit S4 so Flash Boy computers have quit
I'm calling it a day-thanks for coming-see you next week-take some courses
9/6/2024 11:13:49 AM MT Al****:: put a Face Of God chart in the CCT Room
9/6/2024 11:12:58 AM MT Al****:: look where the Moon time lines are
9/6/2024 11:03:47 AM MT Robert****:: how you you know which days are "Two Moon Days" in advance, where does it show that on the charts
9/6/2024 10:51:40 AM MT Al****:: today is a "Two Moon Day" with timelines near open and close
can run Moon to Moon, or Moon-Noon-Moon
9/6/2024 10:46:58 AM MT Al****:: that's great Ahab
9/6/2024 10:41:53 AM MT Ahab****:: Great job Al. I covered earlier at plus 55....
9/6/2024 10:36:06 AM MT Al****:: OK-covered my short for +80
9/6/2024 10:14:40 AM MT Al****:: now down a harmonic 90 points on S&P -may get a bounce
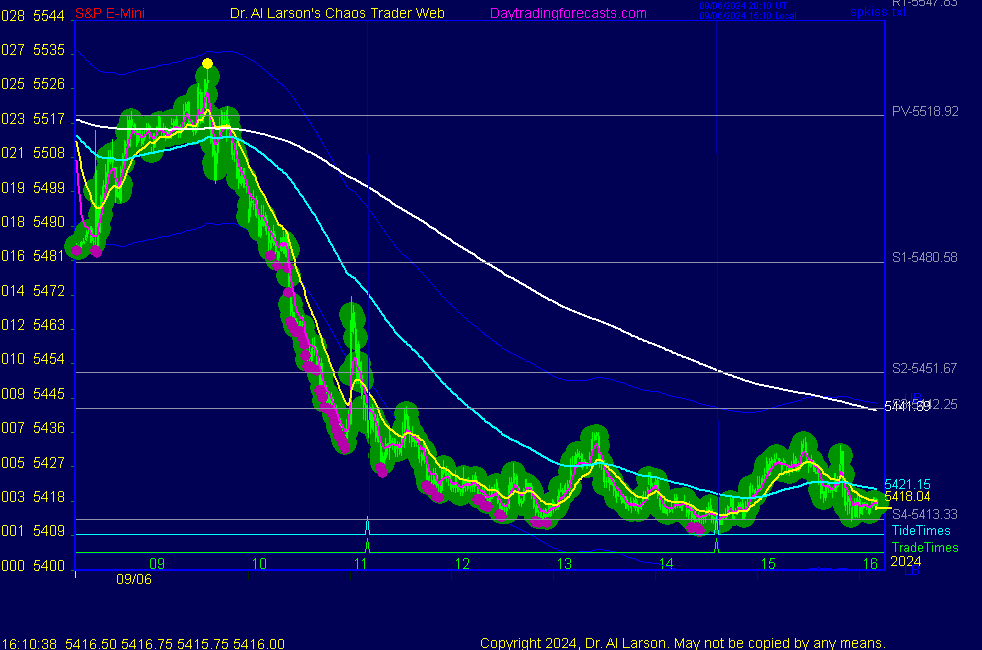
9/6/2024 9:41:30 AM MT Al****:: for longer term trading chart 5 on SPKISS colors the bars with the 44/2400 minute EXMAs-it picked up that September was different
9/6/2024 9:26:24 AM MT Al****:: chart 3 on SPKISS has bars colored by the 36/220 minute EXMAs
they signaled a sell about 5508
9/6/2024 9:21:15 AM MT Al****:: the MTRainbow chart showed the downturn clearly as all the EXMAs rolled over
9/6/2024 9:07:20 AM MT Al****:: today chart 7 was helpful in sorting out the shorter and longer cycles
the rally ran up to the orange level which stopped yesterday's early rally
but the outer cycle was clearly down
the lower orange is 5413.90
9/6/2024 9:02:01 AM MT Al****:: yesterday I pointed out in the chat room that on the SPKISS page charts 5, 6, and 7 looked very bearish
9/6/2024 8:19:09 AM MT Al****:: on the SPSunMoon chart you see the high on the Moon T270 timeline,
followed by a drop through the Moon flux crossover
9/6/2024 7:40:05 AM MT Al****:: Good Morning visitors. Welcome to the Chaos Clinic.
The written Chaos Clinic is on the AUX page.
This site has a lot of charts,
so you may find it useful to have several of them available within your
browser. If you have a tabbed browser, you can open separate charts
in separate tabs by right clicking on any link, and selecting "open in new tab"
from the menu. The main list of site pages is at
http://daytradingforecasts.com/chartlistsec.asp
Recommended pages to watch are SPKISS, MTRainbow, and Chat.
For astro stuff, add SPSunMoon, Wheel, and Chaos Clinic.
A special set of Dr. Al's research charts are on the Secret page.
Comments in the chat room are announced by a
"duck call" noise. This noise also occurs when the software detects a
resonant hex pattern on the Wheel page. MoonTide trading tutorials
are on the right side of the ListOfCharts page. One should
read Trading the MoonTide Tutorial and Keep it Simple as a minimum.
Many subscribers do not strictly trade the MoonTides, but use the charts on this
site as input to their own trading strategies. For example, charts 5 and 6 on the
SPKiss page are a good starting point for swing traders.
Also on this site is the Certified Chaos Trader's Room. That room is open
to graduates of my 4 main courses. See http://moneytide.com -> Courses for details.
9/6/2024 5:28:48 AM MT oag****:: Good morning everyone! Hope everyone has a prosperous day!
9:00 Eastern-System: No comments
![]()
![]()