Yes You Can... Cash In On Chaos!

Chaos Clinic Recap


Here are Al's comments
2:44 passing on last trade-looks like hold up into the close-thanks for coming-see you next week-take a course
2:42 specialists being aided by the hex pattern in the energy field
2:37 putting sell stop at 43.5; specialists trading out their paper; drop only when they are done
2:35 stuck on square of Mercury
2:33 44 holding
2:32 ready to sell
2:28 watching for a sell setup with some juice ; need to break 440 EXMA at 44
2:24 smells like a head fake- specialists in control; support now up to 45
2:21 got buying-not taking buy for reasons given earlier
2:18 at Tide time-watching for sell; need to break 43.5 to get any motion
2:16 OK, there it is-Sun/Uranus/price/Moon -hex patterns tend to stabilize price
2:14 getting an audible signal that the hex recognizer program has found a hex pattern, but it has not posted a chart yet
2:11 now we will start seeing selling coming in, since the high has held for 2 1/2 hours
2:08 this is where the stock specials like it on Friday afternoon-flat, trading within the range
this lets them adjust their own accounts so they can take the other side of what they see coming next week
2:05 need to break about 43 to get a decline moving well; below the 440 EXMA on Rainbow
2:01 rally failing as come into last Tide time; see high of 1250.75, so 1251.25 could be a stop price on any sell

1:56 just had a 20/110 buy crossing-not taking as a buy because of the double top and fractal pattern
and seem to be on green +Tide
1:54 so far the Tide times have been nearly exact
1:52 tracking green +Tide, so watch for high near 2:18
1:49 retraced 50% of the decline from the top and met resistance-bearish
1:46 the Mercury timeline is near 2:40 as well; watch to see what happens then
1:41 meanwhile, we are stuck near 1245 -the earlier energy center price, and square to Mercury
1:40 I have identified an energy center near 2:40, 1242 using Face of God pattern on MTRainbow chart
1:36 on the Rainbow chart, all of the EXMA's are above 1240-this means a break of 1239 will trigger programmed selling
1:33 that same tool tells me to expect some selling late in the day-may set up the 3rd trade
1:30 a tool from the Chaos Trading Made Easy course helped me decide to take my 5
1:27 the big guys like to keep things calm on Friday afternoon, so we may just hold up
1:23 now I can watch for a break of that low by 2 ticks = 1240.25
1:22 took it because got support at the 10:30 ish low
1:20 OK, took +5-can always resell
1:18 this is the hard part-looking at +5 and not taking it
1:15 stop now to 46-just above the 55 min EXMA
1:08 looks like the 440 will be broken-will keep my stop at the 110 EXMA for now
1:03 right here I just wait-I have a stop for a .5 gain, and time is on my side; the up CC is done
1:00 the 440 EXMA marks the middle of the day-if we go as far below as above, drop to 1230
12:55 stop to 47-getting support on 440 EXMA on Rainbow chart; watch to see if 440 also kinks
12:53 I think this will make 9 or more, judging from the way the 110 kinked -stop to 48.5
12:49 I like the way this started; stop to 49.5, .5 point above the kink in the 110 EXMA
12:47 stop 50.5, adjust to 3 points
12:46 sold 47.5 stop 52.25
12:41 110 EXMA is curling downward
12:35 rally has held up more than 2 1/2 hours, so will attract some buying-question is, how much?
12:33 at the vertical grey Saturn timeline
12:30 support is at 48 ; need to break it by at least 2 ticks
12:25 now watching just the SPKISS chart - have top candle wick at 1252.75, so can put buy stop at 1253.25 if get a sell
12:18 I'm not interested in a continuation buy because of the 2 day double top and fractal pattern
12:13 while waiting, I'm looking for a stop location-broke 54, the broke below it, so 54.5 is a good initial stop price
12:08 coming into second trade time, looking for a 20/110 sell; need to break below about 47.5
11:47 I now see a physical reason for the high, so as I come into the second trade, I know where a buy stop can be placed;
at 1257.5; if I get into a short, that stop should be good
11:42 the high was set by Saturn-see the Wheel of Fortune; the Sun is separting from its conjuntion with Saturn
11:33 so far tracking the red -Tide, and looks like a 2 day up Chaos Chamshell (CC) may have just completed
11:30 on the 3 minute candles, stick traders sold the break of the first red candle
11:28 if fall back below 1254, should see some "double top" selling
11:23 testing yesterday's highs-marginal break so far
11:17 the repell off the SA/SR popped price up so move 7 is normal now
11:07 this suggests the market turns down sometime today-so one of the two remaining trades could set up well
11:04 on the MTRAinbow chart we see a 2 day 7 move up Chaos Clamshell, with move 7 being a "runt"
Move 5 was exaggerated by the Lehman takover rumor late yesterday 
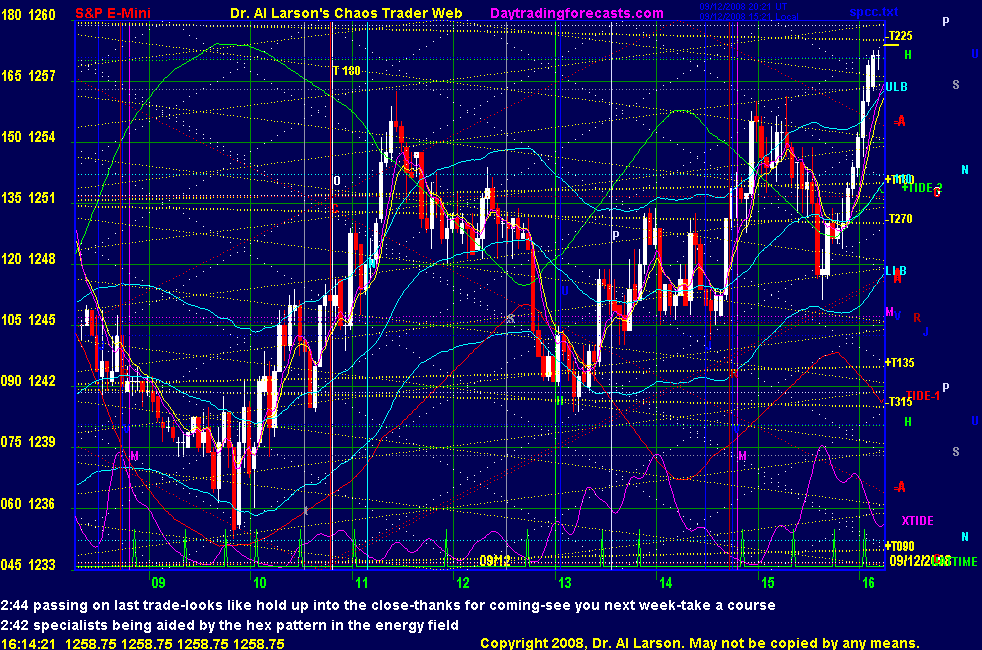
11:01 up-could be the high at 11 normal on a gap down day-but holding above 45 suggests market holds up for a while more
10:56 looking like down right now
10:44 watch for the repelling action after 11:00; if below 1245, go down, else up
10:37 I have an energy center at 11:00, 1245; it is acting as a strange attractor(before 11:00)/repellor(after 11:00)
10:34 I'm still reading this as a weak market
10:30 stopped for zero; fine by me
10:28 stop 44; 5 point cover is 49 if get there
10:26 stop 43.5
10:23 stop 42 -just under the 20 EXMA
10:20 got 20/110 buy -bought 44 stop 41; not real optimistic, but must take the signal
10:11 upside looks limited, still may break down-on gap down day like today, often get a high near 11:00, so watching for that
10:10 now trading both sides of 110-so stay out
10:05 time to just watch-all that to-ing and fro-ing went nowhere
10:04 out flat-no go
10:00 resold 39 -stop 43 ; trying to be both careful and patient
being persistant because this is fibrilation, a precursor to chaos
9:57 aborted -1 again
9:55 very noisy
9:48 resold 38 stop 43
9:46 the MTRainbow chart the low was on the white 440 EXMA-needs to break it for a solid decline
9:45 probably should have waited until exact time
9:43 out -1; don't like it
9:39 this is a continuation sell going into the the trade time-sold 1238,stop 1241
9:35 today we have 3 trades: 10:00 12:44 14:18 -so for now just watch
9:24 down more than 15 pts from overnight high-looks like on red -Tide-could get a narrow range after decline bottoms
9:15 Preoutcry is selling off from overnight high
Certified Chaos Traders: I have posted a new chart in the CCT room; log in with last name and email address for access
9:10 Good Morning from Chaos Manor
Chaos Clinic comments appear on the Chaos Clinic, SPKISS, and MTRainbow pages
Besides the comments made by Al, the chat room is has live
comments from other traders who sometimes share their views,
trades and tips. Below are the chat room comments from this clinic


9/12/2008 9:23:27 AM Mountain Al:: BLP-look at the SPKISS chart, and read the tutorials, expecially Keep it Simple
9/12/2008 9:18:05 AM Mountain cgm:: looking @yesterday as a bear trap on rollver, shouldn't we rally into Mon. full moon?
9/12/2008 8:41:52 AM Mountain BLP:: hi. i'm brand new and looking at your chart. i have no idea how to interpret it. is there any help for me?
9/12/2008 7:18:25 AM Mountain DBJ:: GM all and good trading
9/12/2008 7:12:38 AM Mountain Al:: GM all-good luck today
Chaos Clinic comments appear on the Chaos Clinic, SPKISS, and MTRainbow pages
9/12/2008 7:02:42 AM Mountain BLP:: Is the the chat room for the Friday clinic?
9/12/2008 5:21:03 AM Mountain mm:: gm all - have a great day

9:00 Eastern-System: No comments


Home Up

[ Live Clinics on Friday on DaytradingForecasts.com ]