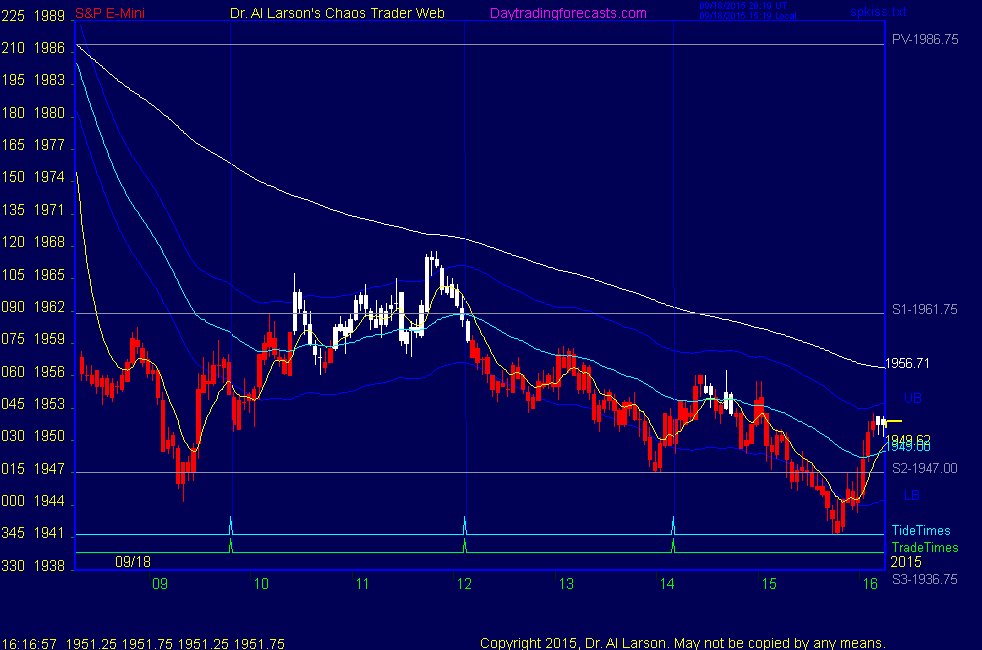


3:14 I'm done-thanks for coming-see you next week-take some courses
3:13 covered for +5
3:06 OK, stop held - now time to cash in on chaos
2:46 sold 1953 stop 1956
2:20 watching for a 20/110 continutation sell
2:18 aborting for -1 ; may resell
2:08 just missed my stop by a tick - too close-moving up to 1954.5-just above the 110
2:03 some buying at the S2 pivot
2:00 note how the EXMAs are diverging now - now I can lower the stop to 1953 - just above the 55 minute EXMA
1:58 stop to 1955 -risk is now $150
1:54 Velcro ripping-I will just try to ride this one
1:52 stop now to 1956
1:47 after 2:30 I expect a second wave of selling
1:41 short from 1952 stop 1957, lowering to 1956.5
1:39 about to move sharply
1:37 what I like here is that trade is staying below the 110
1:33 my stop looks too close-moving stop to 1957, above the 110
1:31 failure to rally there means the trend is now down to the clsoe
1:24 taking 20/110 continuation sell at 1952 stop 1955 going into trade time
1:23 stopped for 0 - fun to watch though
1:18 the Moon +T180 flux is slowly lifting prices
1:10 from the low we have a rally and a pullback with a higher low-an AB of an ABC or 12 of 7 in a Chaos clamshell
1:07 now the EXMAs are turning up
1:05 stop to 1953; break even
1:03 passing solar noon - often is a significant point during the day
1:00 my risk on this trade is $75 - pretty easy to write a check for that
12:55 now I have a Face Of God pattern confirming the setup
12:48 bought 1953 stop 1951.5 - a CTME setup
12:42 OK, not yet
12:40 in the Chaos Trading Made Easy course there is a technique that would buy right here at 1955
12:34 taking a break now until near the next trade time
12:26 probing for support on the Moon +T180 electric filed flux line; if you just look at the Moon flux lines, this
is a 50% pullback
12:23 in hindsight I should have either take 5 points or pressed my stop just under the green swan
12:19 the market has now held up for 3 hours, so it is flat to up for the rest of the day
12:16 Not taking the 20/110 sell ; I make one try and that it is enough
12:18 OK, stopped out - held it too long
12:08 may get stopped, but sitting tight - I've lowered my risk to $175
12:05 now a Face of God pattern says this dip ends near 12:20; trading down to the S1 pivot price
11:57 here we got above the 220 minute EXMA, but still below the 440, which is flattening
it needs to curl up
11:51 Green Swan rally-Green Swan ends day near 1980
11:48 raising stop to 1957.5, one tick under last low
11:45 the risk there is $250; a technique for accepting the risk mentally is to write a check for that amount; due to trading coach Mark Douglas-Trading in the Zone; recently passed away
11:40 bought 1961 stop 1956 for now 20/110 continutation
11:37 I have a Face Of God pattern suggesting this dip ends near 11:45
11:32 some selling - I think this is a small congestion that ends near the trade time
11:27 in the trade window now -110 is up and 20 is above it -waiting a bit
11:05 from the low 7 small moves up - rally may be ending - pretty short 90 minute fractal
10:50 support on the green swan line - the Rainbow of EXMAs is converging
10:43 pullback of 9 points in a few bars - challenging
10:34 It looks to me like the next trade time might work-it is about the time that a second wave of buying
would come in if the low holds - get that from doing my own Chaos Trading Made Easy homework
10:32 popped up to the 220 minute EXMA then faded; watching for it to settle down now
10:31 pretty volatile - hard to use close stops
10:13 turning up, but I'm going to wait for the second trade time
10:02 the trend is down, but market is probing for a bottom
9:53 from the low have a rally and pullback-possible 1-2 of 7 moves in an up Chaos Clamsehll
9:46 I'm not in any hurry to do anything yet
9:39 had a red swan/ green swan crossing just now, and buying off of the S2 pivot price
9:08 market down overnight; trade times are 09:49 12:07 14:10 ; first one is probably too oversold to trade
9:00 Good Morning. Welcome to the Chaos Clinic. This site has a lot of charts,
so you may find it useful to have several of them available within your
browser. If you have a tabbed browser, you can open separate charts
in separate tabs by right clicking on any link, and selecting "open in new tab"
from the menu. The main list of site pages is at
http://daytradingforecasts.com/chartlistsec.asp
Recommended pages to watch are SPKISS, MTRainbow, and Chat.
For astro stuff, add SPSunMoonMer, Wheel, and Chaos Clinic.
Chaos clinic comments appear at the bottom of the SPKISS, MTRainbow,
and ChaosClinic pages. Comments in the chat room are announced by a
"duck call" noise. This noise also occurs when the sofware detects a
resonant hex pattern on the Wheel page. Trading tutorials
are on the right side of the ListOfCharts page. One should
read Trading the MoonTide Tutorial and Keep it Simple as a minimum.
9:00 Eastern-System: No comments