![]()
![]()
********************************************************************************
Longer Term Forecast for S&P
Chaos Clinic for 10/9/2020
********************************************************************************
There is no doubt that the COVID-19 pandemic has had an enormous economic effect on the
world. Many of the jobs lost will never come back. The World Bank on its
website says:
"The June 2020 Global Economic Prospects describes both the immediate and near-term
outlook for the impact of the pandemic and the long-term damage it has dealt to prospects
for growth. The baseline forecast envisions a 5.2 percent contraction in global GDP in 2020,
using market exchange rate weights the deepest global recession in decades, despite the
extraordinary efforts of governments to counter the downturn with fiscal and monetary policy support.
Over the longer horizon, the deep recessions triggered by the pandemic are expected to
leave lasting scars through lower investment, an erosion of human capital through lost work
and schooling, and fragmentation of global trade and supply linkages."
But there is much more going on than COVID-19. Even before the pandemic, there were concerns about
the global economy slowing, as well as increased concern about the economic effect of climate change,
All of this makes one wonder what is going on. To answer that, I look to longer term astro cycles
and energy forecasts based on my theory of Market Astrophysics.
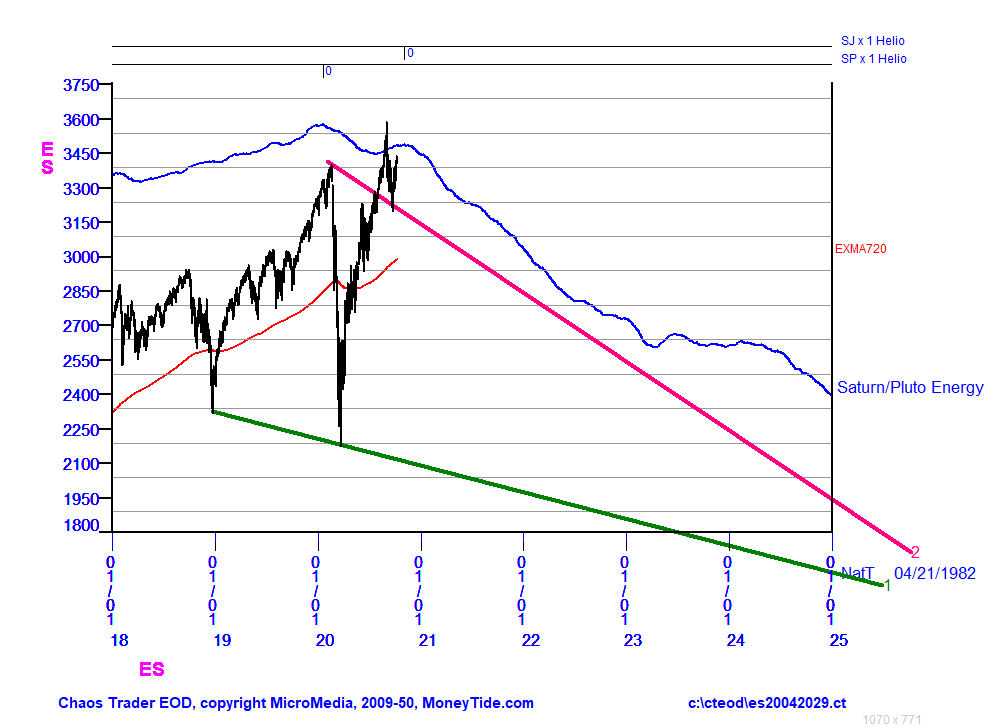
This chart shows several years of S&P futures, along with an energy forecast based on
the S&P's reaction to the Saturn Jupiter cycle. Along the top of the chart are two time lines
showing the heliocentric conjunctions of Saturn and Pluto on 2/21/2020, and Saturn and Jupiter
on 11/4/2020. These dates differ from the geocentric dates used by most astrologers, which are
1/24/2020 and 12/22/2020 respectively. Many astrologers are warning of a major change on the
geocentric Saturn Jupiter conjunction in December. I use heliocentric cycles because that is when the
planets stir up the sun, producing the energy that flows to earth, where it is focused by the geocentric.
The blue Saturn/Pluto Energy forecast is a ZGO forecast made with the WinXGO program, available at
MonyTide.com. Note that the forecast has peaks near each of these two conjunctions.
Because of the long term filtering, the peaks are rounded. The important thing is the longer term
downtrend. This forecast suggests several years of economic contraction.
WinXGO and other products are available at
Moneytide.com
10/9/2020 1:56:04 PM MT qq:: Not sure it will show up soon but RSP (Equal Wt SPY) has been dropping to SPY since open.
10/9/2020 1:23:47 PM MT Al****:: have agood weekend everyone -stay safe
10/9/2020 1:12:36 PM MT Al****:: no, JAB but I'll check it out
what I',m seeing now is that on the last chart on the SPKISS page
is that move 7 up may be ending
10/9/2020 1:03:05 PM MT JAB:: Al, are you aware of the Jup-Uranus harmonic between March low and Sept high? 2. Any thoughts about the NOV 2020 Spx retracement?
10/9/2020 1:01:47 PM MT sil:: Thanks for the swan answer. I like the wind analogy. Helps to understand their possible effect.
10/9/2020 12:53:19 PM MT Al****:: did not break above ESnat360 white vibe
10/9/2020 12:45:26 PM MT qq:: Recent 1 minute down bar happened at 2:42 natural time.
10/9/2020 12:43:13 PM MT Al****:: I'm done for the day-thanks for coming-see you next week-take some courses
10/9/2020 12:40:09 PM MT Al****:: stopped out
10/9/2020 12:37:52 PM MT Al****:: the red and green swans are like winds - they may or may not
catch the sails, depending on other cycles
10/9/2020 12:36:22 PM MT ...:: 6 red swans produced no effect what so ever. So one would assume that the red swans are out of order today. As we are in a trrong up trend I would be loooking at the green swans.
10/9/2020 12:35:31 PM MT Al****:: I went to lunch
10/9/2020 12:32:03 PM MT ...:: As AL is not answering may I be bold enough to answer, regarding the red swan sometimes they work and sometimes they don't. Look at the number of times they miss.
10/9/2020 11:55:58 AM MT sil:: Al, we are about to hit a Red Swan. What are you thinking about that bit of information in the current uptrend and holding trade position you have?
10/9/2020 11:49:19 AM MT Al****:: mid-day sags are hard to sit through, but I had a stop in for a gain so I could wait
10/9/2020 11:41:20 AM MT Al****:: now looks like getting it on most recent natural time
10/9/2020 11:38:07 AM MT Al****:: On my chart I drew a support line from the low near 10:30 to this recent low ; watching for a rally off of it
10/9/2020 11:27:56 AM MT Al****:: dipped down to 220 - stop OK for now
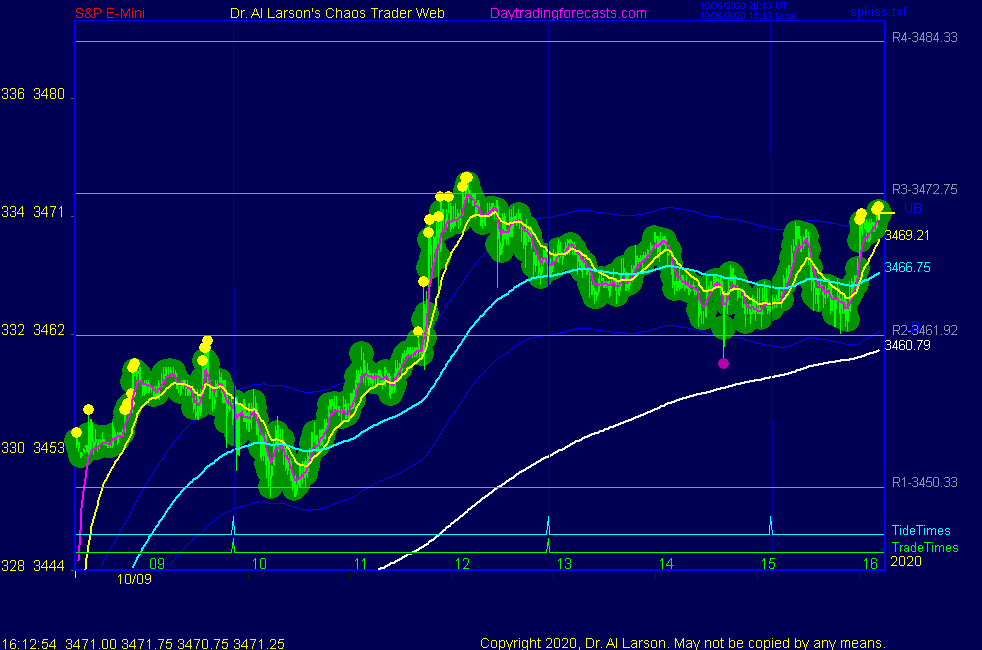
10/9/2020 11:09:27 AM MT Al****:: on secret->esnat72 trading on yellow vibration, one up
from the early green; suggests should reach the white near 34801; R4 is 3484
10/9/2020 11:04:17 AM MT Al****:: these timelines are when the rotating earth moves the NYSE past the planet or an aspect of the planet
10/9/2020 10:57:18 AM MT Al****:: on SPSunMoon chart low came on Venus timeline - now passing Moon and Sun timeline
10/9/2020 10:51:48 AM MT Al****:: getting a dip coming into second trade time - since I'm trying to hold put my stop under the 220 as 3346
10/9/2020 10:40:46 AM MT Al****:: I have placed a Fractal of Pi chart in the Certified Chaos Trader's Room. That room is open
to graduates of my 4 main courses. See http://moneytide.com -> Courses for details.
eMylar Fractal of Pi overlays help you be patient, since they show you future potential moves.
The best bargain in my courses is to take the Cash In On Chaos and Fractal of Pi courses and
learn to use the FOP overlay. Then take Chaos Trading Made Easy, and finish with Face Of God.
10/9/2020 10:35:18 AM MT Al****:: this is a good trade, with upward momentum so it makes sense to carry it through the second trade time
10/9/2020 10:16:42 AM MT SK:: Nice!
10/9/2020 10:07:52 AM MT Al****:: yes, about 10:45 Eastern
10/9/2020 10:05:19 AM MT SK:: Oooohhh ok. So when price moved back above the cyan EXMA and the bar turned white, you took the continuation trade, right?
10/9/2020 9:59:42 AM MT Al****:: look at the third chart on the SPKISS page - my early discussion was in reference to that chart
10/9/2020 9:58:41 AM MT SK:: Ok thanks Al, I'll read it. What time did you take the continuation trade? That will give me some perspective in relation to 9:52. Thanks again!
10/9/2020 9:54:50 AM MT Al****:: one does not automatically buy or sell at trade time - that gets you in a window where you look for a trade - many things help, like knowing the gap up buy at 11:00 tendency, and how to use the rainbow of exmas - see the tutorial on trading the moontide rainbow linked on the right side of the list of charts page
10/9/2020 9:54:31 AM MT SK:: Awesome thanks Al!
10/9/2020 9:51:57 AM MT Al****:: I bought the continuation trade as per my comments -entry was 3455.25
10/9/2020 9:50:41 AM MT Al****:: the daytrading forecast subscription gives you access to this site, which does include the secret charts - the vibration levels are 45 points apart on esnat72 and 225 points apart on esnat360 as currently set
10/9/2020 9:44:53 AM MT SK:: I apologize, I could've been more clear in my questions. I'm considering getting your daily moontide forecasts. That quarterly service is what I would start with, so I wouldn't have the Secret-esnat 360 vibration levels. So if you would, please share how you traded the 9:52 moon tide. Long or short? What time did you enter the trade? What specifically did you look for and what determined the direction you traded? Profitable? Thanks Al...and thank you for the free video showing how to make the energy tools you used to sell. Most appreciated!
10/9/2020 9:40:46 AM MT Al****:: flash boys bought R1. On such days they usually gun for R4 which is 3484 - flash boy programs mainly work off the bid/ask patterns
10/9/2020 9:31:52 AM MT qq:: Accum/Dist line looks week compared to upward move.
10/9/2020 9:22:23 AM MT Al****:: I'm watching the Secret->esnat360 vibration levels
last Friday low was on green -now on white-if break above it next green is about 3531
10/9/2020 9:21:14 AM MT SK:: Good morning Al. Thanks for opening up for guests on Friday's. How did you trade the 9:52 moon tide? Long or short? What time did you actually enter the trade? What specifically did you look for and what determined the direction you traded? Thanks again!
10/9/2020 9:17:17 AM MT qq:: I did a daily graph of $VXV:$VIX with SPX behind it and see some glaring divergencies on occasions which always correct. Such is the current time.
10/9/2020 9:12:59 AM MT qq:: Thank you Al re gold.
10/9/2020 8:57:54 AM MT Al****:: you can check out what I said about gold in my Chaos Clinic blog on moneytide.com
10/9/2020 8:48:26 AM MT Al****:: yes, I like what gold is doing. I use GLD EFT for investment account
it runs on its own cycles so I don't try to read any S&P action from what gold is doing
10/9/2020 8:46:15 AM MT Al****:: there is the continuation buy
10/9/2020 8:41:01 AM MT qq:: Gold up strong to S&P
10/9/2020 8:31:44 AM MT Al****:: this is where context comes in -even though there is a 20/110 down crossing, the 220 and 440 minute EXMAs are up so one would not sell
10/9/2020 8:16:54 AM MT Al****:: traded down to the R1 pivot price - looks like Flash Boys bought it -every trader NEEDS to read the book FLASH BOYS
10/9/2020 8:07:31 AM MT Al****:: there is a tendency on that chart of "gap up, buy a low at 11:00"
10/9/2020 7:59:02 AM MT Al****:: third chart on SPKISS page showing possible continuation buy setup
dip bounced off green vibration on secret->esnat72
10/9/2020 6:56:20 AM MT Al****:: rally is on a green swan
10/9/2020 6:55:44 AM MT Al****:: on secret esnat72 moving up from green vibration - could go to next green up
10/9/2020 6:36:29 AM MT Al****:: qq, can you even get anything at Starbucks for less than $5 ?
10/9/2020 6:32:51 AM MT Al****:: Good Morning visitors. Welcome to the Chaos Clinic.
The written Chaos Clinic is on the AUX page.
This site has a lot of charts,
so you may find it useful to have several of them available within your
browser. If you have a tabbed browser, you can open separate charts
in separate tabs by right clicking on any link, and selecting "open in new tab"
from the menu. The main list of site pages is at
http://daytradingforecasts.com/chartlistsec.asp
Recommended pages to watch are SPKISS, MTRainbow, and Chat.
For astro stuff, add SPSunMoon, Wheel, and Chaos Clinic.
A special set of Dr. Al's research charts are on the Secret page.
Comments in the chat room are announced by a
"duck call" noise. This noise also occurs when the sofware detects a
resonant hex pattern on the Wheel page. MoonTide trading tutorials
are on the right side of the ListOfCharts page. One should
read Trading the MoonTide Tutorial and Keep it Simple as a minimum.
Many subcribers do not strictly trade the MoonTides, but use the charts on this
site as input to their own trading strategies. For example, the bottom chart on the
SPKiss page is good starting point for swing traders.
Also on this site is the Certified Chaos Trader's Room. That room is open
to graduates of my 4 main courses. See http://moneytide.com -> Courses for details.
10/9/2020 4:14:51 AM MT qq:: From overnight price action it looks like it might form a possible lower high. But that opinion and $1 might only get you the cheapest cup of Starbucks.
9:00 Eastern-System: No comments
![]()
![]()