
Chaos Clinic Recap
Here are Al's comments
3:08 OK, I'm done for the day; thanks for coming; take a course; see you next week
3:03 out for -1; no go
3:00 still stuck on the Pluto +P180 flus; been there for 4 hours
2:53 still OK; coming to Mars R 0 timeline
2:33 stop now to 1167; Fractal of Pi says to hold to close, so I will try to do that
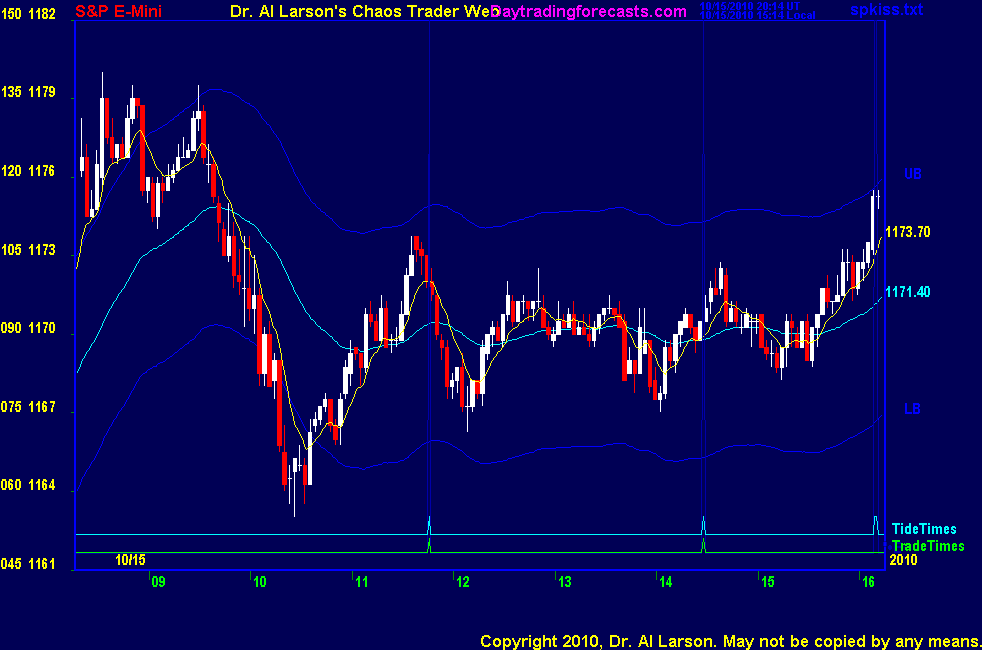
2:28 at exact trade time; bought 1170.75 and cancelled 1172 buy stop
2:24 passing Venus V0 timeline with price on Venus +V225 flux
2:20 that dip was where my FOP said it should be
2:16 putting buy stop at 1172 and sell stop at 1166.5
2:10 today looks like an Elliotte ABCDE correction to yesterday's rally
2:08 decent bounce off the Moon flux; now needs to get above 1171.5
2:03 support on the Moon +T315 flux
1:53 when the EXMA's longer than the 440 are flat, the 20/110 crossings usually have no follow through
1:51 dip passing the Moon T90 timeline was quickly reversed; did it pick up enough Moon Juice for a good rally?
1:44 dip down to the green 1760 EXMA on the MTRainbow chart
1:40 still flat coming into the trade window; need about 1172 to spark a rally
1:24 there are no guarantees that a fractal pattern fill complete; fractal comes from the word fracture.
But if the Fractal of Pi I'm watching completes, we should see a rally starting near the next trade tine.
1:12 the EXMA's are flat=dullness. Many traders leave. They miss the Chaos that follows Dullness.
1:02 when the market holds up for 2 1/2 to 3 hours, it usually attracts more buying
12:56 this area is the Midday Doldrums; getting little dip passing the Sun and Mercury H0 and M0 timelines
12:53 I use my overlays primarily on my two day charts, like the MTRainbow chart.
12:51 FOP trade looking good; next hotline trade is near 14:28
12:44 Most traders just use technical indicators. They are one dimensional. Pattern overlays are two dimensional,
so they give a lot more information about the overall behavior of a market.
12:33 Using my eMylar overlays has been very successful for me. Markets are chaotic systems. Chaotic systems for fractals.
My discovery of the Fractal of Pi was a breakthrough
12:30 updated my Fractal of Pi chart in the CCT Room; still says up to the close; as a FOP trade bought 1170.5
12:23 back; got support on the Moon +T315 flux; 440 EXMA is flat
12:00 taking a breakfast break
11:58 stopped for -3 on hotline trade and +2.5 on CTME trade
11:49 hope I didn't press stop too close; backing off to 1168
11:36 stop to 1170 on both trades; I have two trades on: a CTME trade long from 1166.5 and a hotline trade long from 1171
11:32 this is the MoonTide hotline trade
11:29 bought 1171, cancelled by stop; sell stop 1168
11:26 On the MTRainbow chart, the EXMA's are converging
11:22 have a 20/110 EXMA crossing ; placing a buy stop at 1172
11:17 I have placed a Fractal of Pi chart in the Certified Chaos Trader's Room. That room is open
to the graduates of my four main courses. see http://moneytide.com -> Courses for details
11:08 up to the 440 EXMA, which is at the Node O+180 flux; also is the pit Pivot price
11:04 coming into the MoonTide trade window-rallied up to the 110 EXMA; watching for a 20/110 crosssing;
Our trading approach is covered on the Trading The MoonTides tutorial, linked on the right side of the ListOfCharts page
10:59 this is not a hotline trade, but one derived from the Chaos Trading Made Easy course-I bought 1165.5 stop 1162
10:56 the tendency on Fridays is for the market to hold up, so the early drop may get erased
10:51 trading now near the Sun/Mercury +H225 and +M225 flux, which is also the pit trader's Support 1. Pit prices are on the SP1Day page
10:43 Our hotline trading approach does not do counter trend band edge trading; but this looks like a band edge.
10:37 the 110,220, and 440 EXMA's are all tangled near 1171 ; look for a recovery to that level
10:32 quite a swoon; not a planned trade, so just watch; now expecting a bounce
10:28 got support at 1163 ; coming to the Moon T135 timeline
10:19 broke that-yesterday's low was 1162.5
10:13 Moon +T315 flux support is at 1167
10:06 broke that-down to the green 1760 EXMA on the MT Rainbow chart ; near the Jupiter/Uranus +J090 and +U090 flux
10:03 1171 is also the Pluto +P180 electrid field flux price.
9:58 1171 is a prime number-got nice bounce after the Consumer sentiment report.
9:50 their H 45 and M45 timelines come near 10:00, and the Moon T135 timeline is near 10:30; this may be a low of day zone
9:46 on the SPSunMoonMer chart, trade has been attracted to the Sun/Mercury +H270 +M270 electric field flux
9:43 outcry session starting weak. MTRainbow chart shows uptrend, with 440 EXMA support near 1172
9:16 pre outcry up a bit; trade times today 11:46 and 14:28
9:00 Good morning from Chaos Manor
Besides the comments made by Al, the chat room is has live
comments from other traders who sometimes share their views,
trades and tips. Below are the chat room comments from this clinic
10/15/2010 2:28:58 PM MT Al****:: nice; I did about the same
10/15/2010 2:18:20 PM MT TG****:: I bought 68.75 right at the 2:09 tide time and exited at even. Rebought 70.0 and managed to hold for 5 into the close.
10/15/2010 2:02:25 PM MT Al****:: bye-check last chart in CCT Room
10/15/2010 1:47:57 PM MT TG****:: Have a great weekend Al, MM, and everyone else.
10/15/2010 1:47:28 PM MT TG****:: really nasty afternoon. started to form a converging triangle, then seemingly broke out of it to the upside just after the tide time only to go back into the triange. Now that nearly everyone has given up on the upside and then the downside, it wants to make good on that intial strength coming out ot the last tide time.
10/15/2010 9:57:51 AM MT mm****:: The 11:46 looks like a CIT
10/15/2010 8:07:24 AM MT RAH:: Tnx! :-))
10/15/2010 5:49:44 AM MT mm****:: gm all - have a great day
9:00 Eastern-System: No comments


[ Live Clinics on Friday on DaytradingForecasts.com ]