

3:13 now I'm really done -see you next week
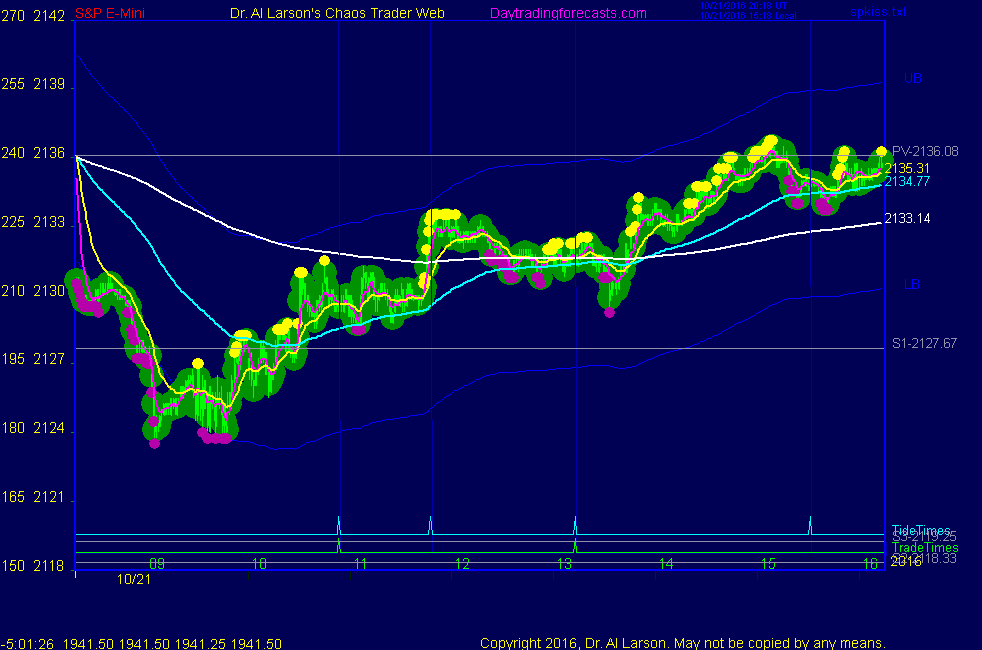
3:12 don't like stall-covered 2136 for +4.25
3:10 I have a sell limit at 2142-don't think we'll see that, but it is a harmonic number
3:07 stop to 2134.5-under 55 minute EXMA
3:05 not much selling at pivot
2:59 stop 2134-just under 55 minute EXMA
2:55 stop to 2133.5
2:50 tricky point here as near the pivot 2136-I think it is soft just like S1 was; holding
2:45 stop to 2133
2:40 stop to 2132.5 just under the 110 minute EXMA
2:38 BBB is asking about Venus. Venus is the nearest planet to
us and interacts so much with earth that our satellites have special hardware
to stabilize them from Venus perturbations
2:35 my plan is to cover near the close if not stopped
2:29 stop to 2131.75-break even
2:24 a 15 point move will be 2139
2:15 stop to 2131 - below the 220 and 440 exmas
2:04 I sometimes think someone waits for me to sign off :)
1:58 stop to 2129.5
1:50 I came back and rebought 2131.75 stop 2128; I got spooked-stop was too close
1:33 OK, out for +1.5 for the day; thanks for coming; see you next week; take some courses
1:31 this is a midday stall-if my stop is hit I'm up 1.5 giant points; so I can just wait
1:27 stop to 2129.5 break even
1:17 Friday afternoons are often dull; MoonTides suggest this one may not be dull;
We shall see
1:12 posted a Fractal Grid (from CTME course) chart in the CCT room
1:07 long from 29.5 stop 29
1:03 just passed solar noon ; often the center of a move
12:57 I have placed a Chaos Trading Made Easy chart in the Certified Chaos Trader's Room. That room is open
to graduates of my 4 main courses. See http://moneytide.com -> Courses for details.
The CTME course is on SPECIAL - see http://monetide.com -> Special offer
eMylar Fractal of Pi overlays help you be patient, since they show you future potential moves.
The best bargain in my courses is to take the Cash In On Chaos and Fractal of Pi courses and
learn to use the FOP overlay. Then take Chaos Trading Made Easy, and finish with Face Of God.
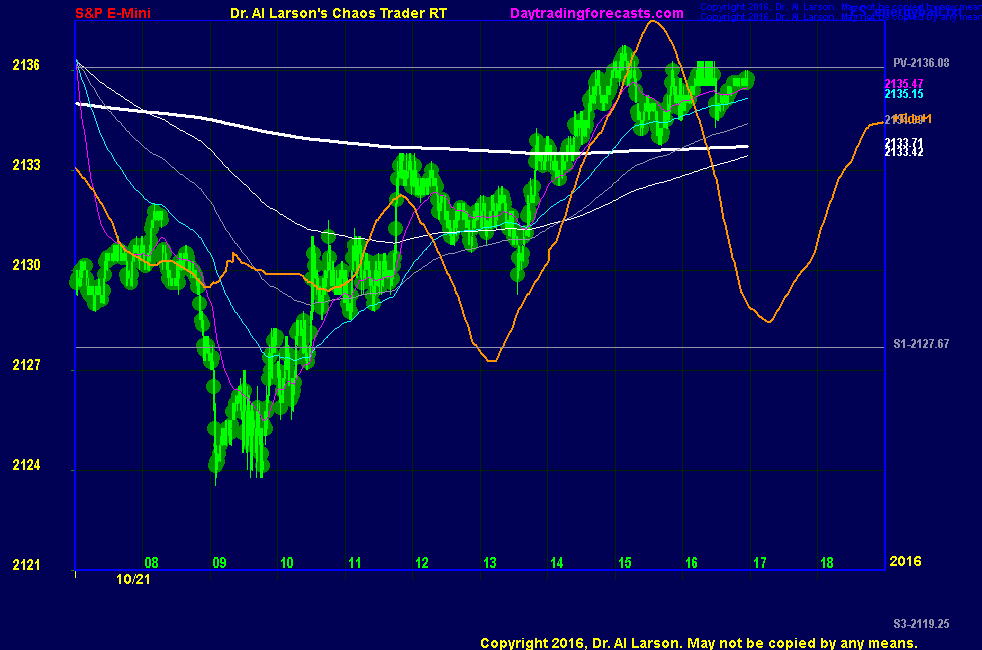
12:44 on the AUX page chart, the heavy white line is the weeks average-if get above it, may go as far
above as below ; 1233-24=9 1233+9 = 1242
12:40 in a rally you want to buy the dips-this is looking like one; if I were not holding, I'd take the second buy on this dip
12:21 got above the 440 minute EXMA - still just holding long 2128 stop 2129
12:02 some math 2118-2142=4 6 point quantums, down to 2125=3 such quantums;
equal move up = 2148
12:00 stop to 2129
11:47 thought it might do that-now have a break even trade-will let it run
11:31 rebought 2129.5 stop 2128
11:25 covering for +1.5
11:15 lost some comments-stop is at 2126.5, risking 1.5
11:11 some resistance at the 440 minute EXMA-shorter ones have all curled up
11:01 still OK - looks like a normal congestion
10:31 they did
10:29 I think the Flash Boy computers will now be buying S1
10:23 so far OK -
10:07 bought 2028 stop 2023.5 for now
10:02 I think we found bottom
9:55 back above Moon flux-positive
9:48 now I've switched my AUX chart to a one day screen-looks like tracking +Tide
9:40 coming to the point where the Exchange conjoins the Node and opposes Neptune-timed yesterdays wild gyrations
9:37 minor double bottom
9:33 on Jupiter flux, 18 points below the high flux yesterday
9:22 2124 is only 18 points below the 2142 level we saw this time last Friday, and again yesterday
9:17 yesterday we saw some wild moves just after the normal session open; may see them again today
9:05 broke all astro support
8:54 on the AUX page I am showing my 3 day analysis chart. The market drifted lower overnight;
in the big void between electric field flux lines. Yesterday's low was set by Pluto and Mars.
This morning prices made a little double bottom on Mercury, then broke it. S1 is at 2127.67, so I expect
computer buying there. The rising Moon +T090 flux is also potential support
8:46 today's MoonTide trade times are 10:54 and 13:13 ; the tides after 13:13 are the strongest
8:45 Good Morning. Welcome to the Chaos Clinic. This site has a lot of charts,
so you may find it useful to have several of them available within your
browser. If you have a tabbed browser, you can open separate charts
in separate tabs by right clicking on any link, and selecting "open in new tab"
from the menu. The main list of site pages is at
http://daytradingforecasts.com/chartlistsec.asp
Recommended pages to watch are SPKISS, MTRainbow, and Chat.
For astro stuff, add SPSunMoonMer, Wheel, and Chaos Clinic.
Chaos clinic comments appear at the bottom of the SPKISS, MTRainbow,
and ChaosClinic pages. Comments in the chat room are announced by a
"duck call" noise. This noise also occurs when the sofware detects a
resonant hex pattern on the Wheel page. Trading tutorials
are on the right side of the ListOfCharts page. One should
read Trading the MoonTide Tutorial and Keep it Simple as a minimum.
9:00 Eastern-System: No comments