
Chaos Clinic Recap
Here are Al's comments
********************************************************************
Ā S&P Attacked by Bears
ĀChaos Clinic for 10/25/2018
****************************************************************
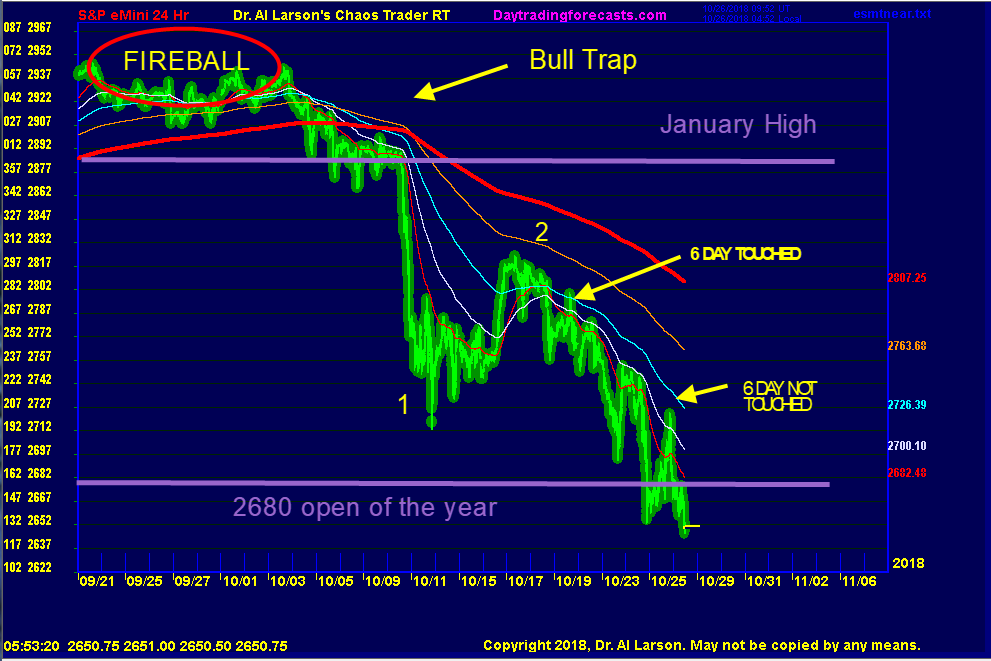
The Bear Market that began with the fireball top has accelerated.
The chart on the AUX pages shows the Fireball top, and the following
selloff. The Fireball is an energy field pattern signalling a major change in trend.
At the time it was formed, the bulls were celebrating a breakout above the
January highs. The celebration was brief, when the market broke below those
highs, creating a Bull Trap. The sharp drop on October 10th was the result.
Following that drop, marked as 1, the market rallied to point 2. From there
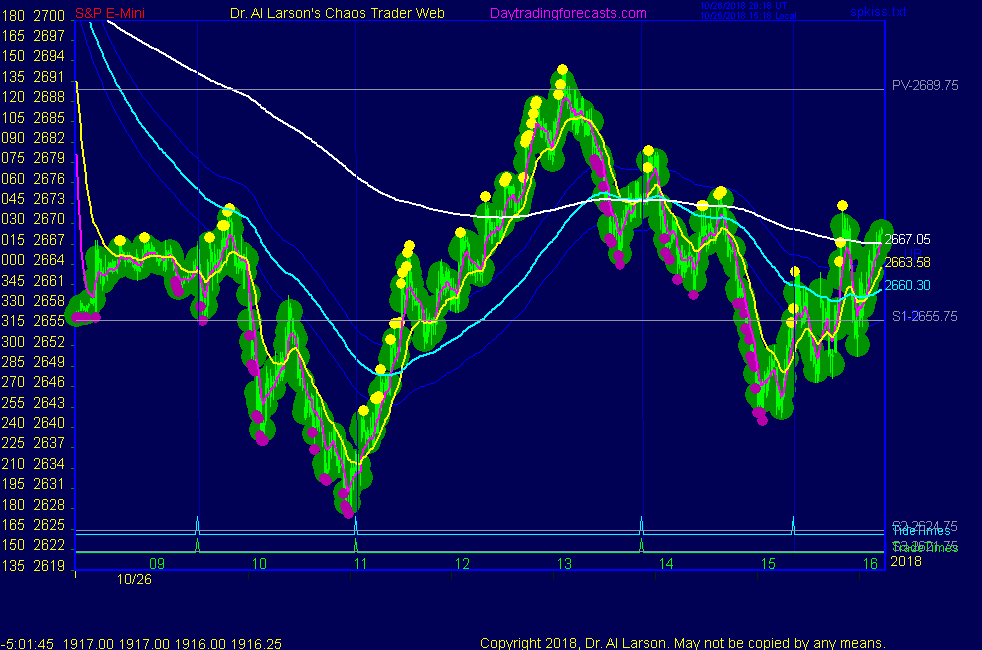
the market sagged, then rallied last Friday morning to touch the 6 day EXMA.
From there the market has declined, but with two sharp rallies.
The most recent of these was yesterday. The rally did not touch the 6 day
EXMA. It was followed by a late drop in the S&P. The decline continued
overnight, and is still in progress. But the evening news last night was
talking about the big up day in the Dow.
The EXMAs continue to point down. It is clear form the GLD and SH
exchange traded funds that big stock holders are hedging their positions.
My cycles work suggests this decline runs into January, but it could
run much longer. I think the Great Bull Market may well be over.
Besides the comments made by Al, the chat room is has live
comments from other traders who sometimes share their views,
trades and tips. Below are the chat room comments from this clinic
10/26/2018 2:48:49 PM MT Al****:: Red tide is working about 60% of the time
10/26/2018 2:22:56 PM MT Tg****:: One last comment. Look at price mimic Red Tide's forecasted moves on SPKiss from 2 AM last night. Big accurate swings one one tide throughout.
10/26/2018 1:57:33 PM MT Al****:: you too, TG, and everyone else
10/26/2018 1:55:02 PM MT TG****:: Have a great weekend everyone.
10/26/2018 1:25:43 PM MT Al****:: about 65% will be in the trade window
10/26/2018 1:12:55 PM MT RR:: All your signal of 11:04 was great and on the mark. I was not sure about 13:52, because correction started at 1:03. I was not sure to take a short position.what are the percent of accuracy in the Timing?
10/26/2018 12:42:05 PM MT Al****:: in the S&P futures one must be nimble and quick, which is hard as one gets older-I usually suggest swing or position trading using exchange traded funds for us older guys
10/26/2018 12:26:51 PM MT RR:: Thanks Al, I am 73 years old, practice medicine for 45 yrs. Like challenges of trading. I like your approach. I thought you are going to give us a hint. I love to learn , but this subject is rather art and has a lot of fine tuning.
10/26/2018 12:20:17 PM MT Al****:: If you look at the 3rd chart on the SPKISS page, the bars are colored by the 20/110 EXMAs - you can see it said sell
10/26/2018 12:15:43 PM MT Al****:: I am not a registered security advisor anymore, so it is illegal for me to tell you to buy or sell. I provide timing and tools
10/26/2018 12:07:06 PM MT Al****:: that's for you to decide-use the tools and rules in the Trading the MoonTide Tutorial, linked on right side of ListOfCharts
10/26/2018 11:56:44 AM MT RR:: Al, at 13:52 is a buy or sell of /ES?
10/26/2018 11:46:47 AM MT Al****:: could get ugly if Dow can't close up
10/26/2018 11:40:04 AM MT Al****:: I see what you mean - computers sold the pivot
10/26/2018 11:14:49 AM MT TG****:: For past several days each time the 220 has crossed up above the 440 it's been a pretty short lived positioning.
10/26/2018 11:09:16 AM MT Al****:: the fine timing of the low came from the exchange opposing natal Moon
10/26/2018 11:05:33 AM MT TG****:: I only slept a few hours and woke up before 5 AM because I thought the bottom to play might happen on that prominent looking tide turn just after 5 AM.
10/26/2018 11:02:46 AM MT TG****:: From the 2944.75 retest of the All time high we dropped 317.5, about 7/8 ths of a circle.
10/26/2018 10:56:16 AM MT TG****:: I saw multiple red QPFE candles then one full bodied white one with it's open near the low of the day. I call that "stepping up off of a bottom". A similar downside pattern happened off of the AM high of the outcry session at the early tide time. They can work at any time throughout the day or fail but of course the odds are better right near a tide time. It's easy to miss these setups because they don't happen every day.
10/26/2018 10:53:37 AM MT Al****:: my inner child wanted to buy that drop all night-then I was eating breakfast when it bottomed
10/26/2018 10:51:14 AM MT TG****:: Well I didn't get it at that level either in case it went through like a hot knife through butter. I bought the bounce. Long 33.25
10/26/2018 10:48:00 AM MT Al****:: I'm embarrassed I missed the 2628 level-I was kept awake all night by the Full Moon and am not fully functional :)
10/26/2018 10:38:13 AM MT Al****:: yes
10/26/2018 10:34:38 AM MT TG****:: Is each level for each color spaced at 45 points. It's hard to make out the text on my screen.
10/26/2018 10:32:48 AM MT Al****:: the big houses will close the dow up
10/26/2018 10:28:30 AM MT Al****:: on esNat360 2080 white down to 2628 is 5 levels - can get 2 or 3 level rebound
10/26/2018 10:20:03 AM MT TG****:: It's going to be tough going back to 12 point daily ranges or worse yet the 9 point range days. Might no be for a while but they'll be back at some point.
10/26/2018 10:19:58 AM MT Al****:: we may have found bottom of a move 3
10/26/2018 10:18:06 AM MT TG****:: Looked a little closer, it's been a pattern of a few 90 point drops this week followed by 60-70 point rallies.
10/26/2018 10:10:46 AM MT TG****:: Looked at Secret charts. Noticed that yesterday's high was just above a white vibration level. The AM low today was exactly on 2 whites below.
10/26/2018 9:53:59 AM MT TG****:: retraced only 38.2% so far and sniffing at another run up
10/26/2018 9:48:55 AM MT Al****:: pop is the operative word - this is incredible volatility
10/26/2018 9:38:38 AM MT TG****:: I sometimes use a Wyckoff method for looking for potential price pivots. This morning, it lined up square on the 2nd tide time as a low. Had 2 independent sources pointing to a low pivot there, although, certainly you can get a pop on the tide time followed by a big fail within 45 minutes based on how the Exmas are aligned against a long position.
10/26/2018 9:18:28 AM MT Al****:: love the way GLD and SH are moving today
10/26/2018 8:49:20 AM MT Al****:: If I divide price by 10 to get degrees, support levels are every 15 degrees (the 12ths) plus the 5ths, every 72 degrees.
Yesterday gave up 270, next lower 255, or 2550
10/26/2018 8:44:07 AM MT Al****:: I don't know how well support levels work in a crash :)
10/26/2018 8:26:43 AM MT TG****:: S2 and S3 are right near the 1.382 extension easily seen on the daily chart.
10/26/2018 8:19:45 AM MT TG****:: 2634 area would be a 1.333 big A-B-C or 1-2-3 extension level, 2623 area for a 1.382, 1.5 would be at the 2595 area and 1.618 all the way down to 2568.
10/26/2018 8:10:09 AM MT TG****:: From the Oct 17th high, on 24 Hr chart, using 27 min bars and the QPFE, this looks like the 11th move down.
10/26/2018 7:45:36 AM MT Ahab****:: GM
10/26/2018 6:33:59 AM MT Al****:: GM all-good luck today
Chaos Clinic on Aux page
9:00 Eastern-System: No comments


[ Live Clinics on Friday on DaytradingForecasts.com ]