********************************************************************************
SH Confirms The S&P Top
Chaos Clinic For 11/01/2024
********************************************************************************
Two weeks ago I asked, "Did The Super Moon And The Comet Top The S&P?"
On Halloween, the S&P dropped sharply. The October top was confirmed
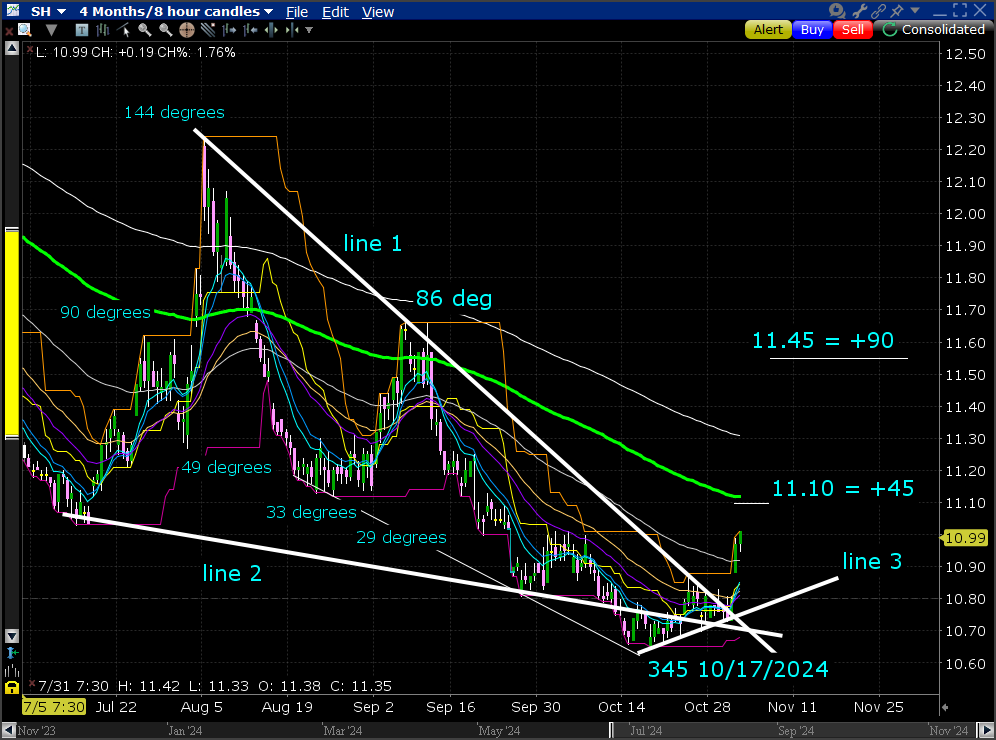
by the SH short S&P Exchange Traded Fund. The chart for this is above.
One of the most reliable chart patterns is a descending converging triangle.
On this chart the triangle is bound by line 1 and line 2. The pattern started in
July, and continued into October. After the October 17th low,
an up sloping move developed, basing on line 3.
On 10/31/2024 prices broke out of the triangle. This is typical of a descending
triangle. The question is, how far could the move go?
SH can be mapped to a circle of 360 by taking the price and multiplying it by 100,
Then prices can be converted to degrees on a circle, repeating circles as price
increases. For example, the high on the chart is 12.24. That is 1224/360=3.4 circles.
Subtracting 3 circles leaves .4. The .4 times 360 = 144 degrees. Several prices
are marked as degrees as this triangle developed. As prices declined, they dropped
below 10.80, the boundary between circles. The low moved to 345 degrees, 15 points
into the lower circle.
Moving back above 10.80 and basing on line 3 warned of the rally at the vertex of the triangle.
The move up could logically move up 45 or 90 degrees. The prices are shown on
the chart. Proceed at your own risk.
For more on my work and to subscribe to Tomorrow's Market Email Hotline and access to daytradingforecasts.com see
Moneytide.com
Software to plot electric field flux lines in NinjaTrader is available at
energyfieldtrading.com

11/1/2024 11:25:25 AM MT Al****:: OK, I'm done for the day-thanks for coming-see you next week-take some courses
11/1/2024 11:24:15 AM MT Al****:: stopped for -4
11/1/2024 11:11:11 AM MT Al****:: got energy from the Sun and Moon timelines
11/1/2024 11:08:52 AM MT Al****:: note the roll over of the EXMAs on chart 3 on SPKISS page
11/1/2024 11:02:22 AM MT Al****:: added some for an average of 5778
11/1/2024 10:59:08 AM MT Al****:: posted a Face Of God chart in the CCTRoom, chart 3
11/1/2024 10:45:38 AM MT Al****:: sold 5777
11/1/2024 10:45:04 AM MT Al****:: the juice is gone - may sell off
11/1/2024 9:51:26 AM MT Al****:: 5 levels on that chart is a good day; yesterday had 7 levels
11/1/2024 9:45:02 AM MT Al****:: on the secrets page on the ESNat72 chart you see the overnight low was on the white flux. The prices ran up to the yellow before the normal session, up 2 levels. Then when the normal session began,
prices bottomed on the magenta level, then ran up to the next magenta level
11/1/2024 9:22:03 AM MT Al****:: that last minor high was on the Sun +Hh000 flux
11/1/2024 9:05:02 AM MT Al****:: that's a +25 so I'm happy
now I seethe high was set by the Neptune +Nh045 flux, just above the Moon +T180 flux
in hind sight, a cover at the Moon flux would have been better
11/1/2024 8:51:49 AM MT Al****:: stopped out 5788 while taking dogs to the park
11/1/2024 8:22:21 AM MT Al****:: cancelled that after seeing move is on a green swan
see the page MoonTides and Black Swans, linked on right side of ListOfCharts page
11/1/2024 8:12:35 AM MT Al****:: I have a cover sell limit order at 5808, the Moon's Node +o045 flux
11/1/2024 7:55:14 AM MT Al****:: today is a New Moon, so the Moon conjoins the Sun with timelines at 13:00 EDT
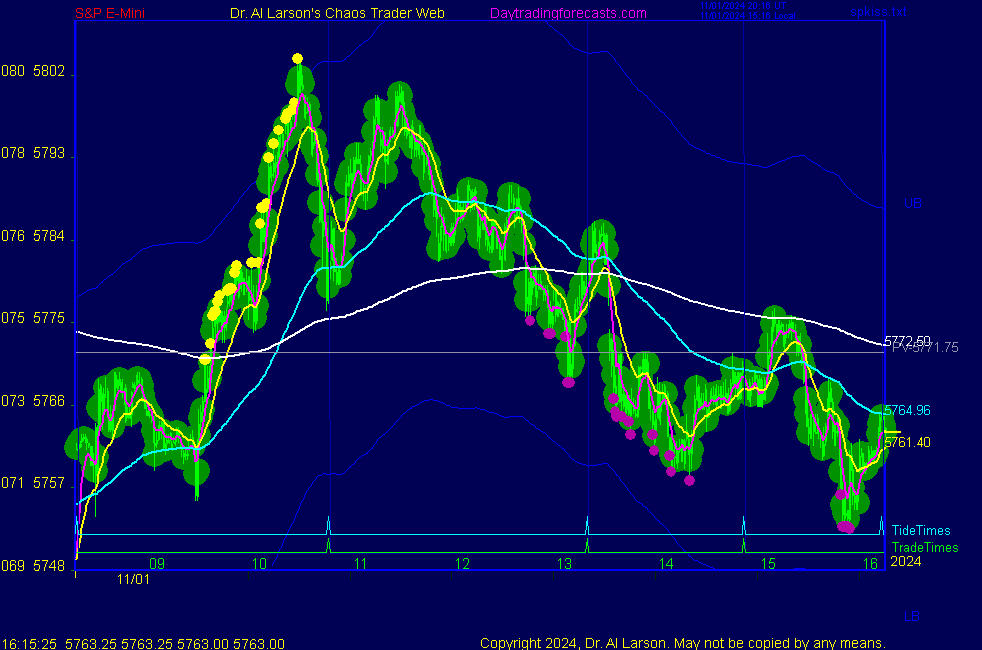
11/1/2024 7:50:49 AM MT Al****:: based on that chart and support on the Moon T+135 electric field flux , I'm long from 5763
11/1/2024 7:21:23 AM MT Al****:: I have posted a Face Of God chart in the CCT Room as chart 2
11/1/2024 6:43:15 AM MT Al****:: Good Morning visitors. Welcome to the Chaos Clinic.
The written Chaos Clinic is on the AUX page.
This site has a lot of charts,
so you may find it useful to have several of them available within your
browser. If you have a tabbed browser, you can open separate charts
in separate tabs by right clicking on any link, and selecting "open in new tab"
from the menu. The main list of site pages is at
http://daytradingforecasts.com/chartlistsec.asp
Recommended pages to watch are SPKISS, MTRainbow, and Chat.
For astro stuff, add SPSunMoon, Wheel, and Chaos Clinic.
A special set of Dr. Al's research charts are on the Secret page.
Comments in the chat room are announced by a
"duck call" noise. This noise also occurs when the software detects a
resonant hex pattern on the Wheel page. MoonTide trading tutorials
are on the right side of the ListOfCharts page. One should
read Trading the MoonTide Tutorial and Keep it Simple as a minimum.
Many subscribers do not strictly trade the MoonTides, but use the charts on this
site as input to their own trading strategies. For example, charts 5 and 6 on the
SPKiss page are a good starting point for swing traders.
Also on this site is the Certified Chaos Trader's Room. That room is open
to graduates of my 4 main courses. See http://moneytide.com -> Courses for details.
11/1/2024 5:30:31 AM MT oag****:: Good morning everyone! Hope everyone has a prosperous day!
9:00 Eastern-System: No comments