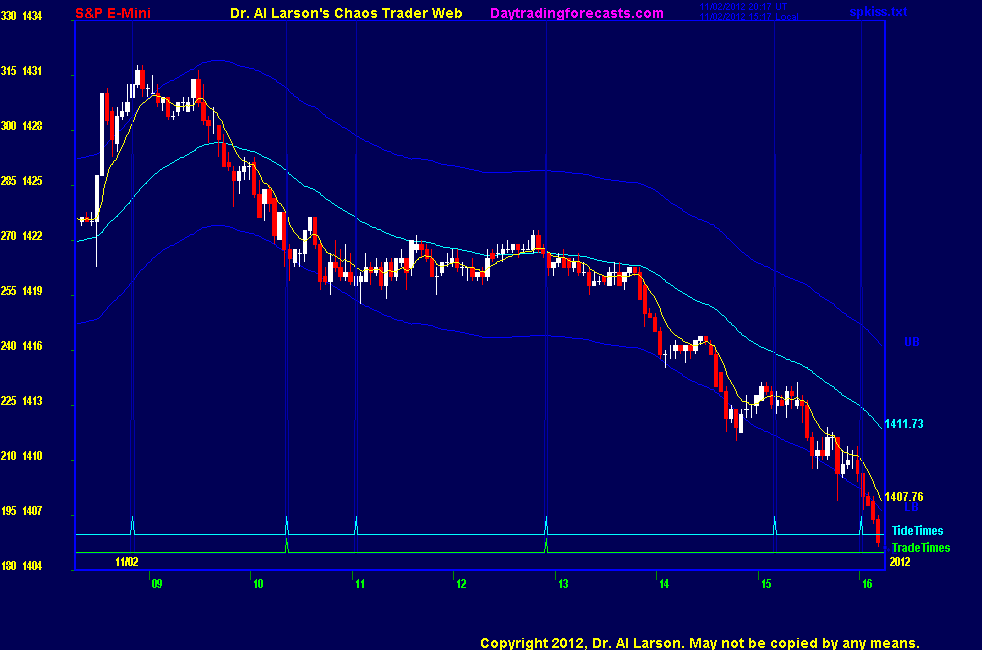


1:23 I'm done for the day-thanks for coming-see you next week-take a course
1:22 early juice disappeared - turned into am "MM stinker"
1:20 aborted for -2
1:14 this may be a hallucination, but I have placed a Fractal of Pi chart in the CCT room
1:09 stuck in the mud
1:04 little dip passing solar noon
12:52 coming to solar noon at 13:00 because on daylight time-remember this changes over the weekend
12:48 today is a "two Moon day" with T270 timeline near the open and T180 timeline near the close
these days often run Moon to Moon or Moon, Noon, Moon
12:43 market based on the Moon +T180 electric field flux line
12:39 bought 1421.75 stop 1418
12:34 a protective sell stop on a buy will go at 1418
12:29 110 EXMA is curling up -watching for a buy setup
12:27 I'm back -see that the market is holding up
11:44 taking a breadfast break
11:42 I have placed a Face of God chart in the Certified Chaos Trader's Room. That room is open
to graduates of my 4 main courses. See http://moneytide.com -> Courses for details.
eMylar Face of God overlays help you be patient, since they show you future potential moves.
The best bargain in my courses is to take the Cash In On Chaos and Fractal of Pi courses and
then the Face of
God course
11:37 have a 12 point quantum range-hex patterns have 12 point sides
11:26 got support at the low of yesterday's congestion
11:22 covered for +1.5 - not going
11:19 stop to 1422.5
11:13 stop to 1423
11:10 need to be patient here
11:04 stop to 1423.5 - just above the 110
11:01 I like that the 110 EXMA is straight and pointing down
10:53 have a hex pattern automatically reconized by site softwar-see Hex Wheels today and the tutorial on hex Wheels
linked on right side of ListOfCharts page
10:46 this could turn into a serious down move-on a daily chart this is the start of a move 7 down from Sept 14th
10:43 stop to 1424
10:32 intersting: on a 24 hour chart, the rally from yesterday's low was 36 hours; a 3/2 harmonic of the day
10:23 looks like this was a case of "sell the news" on the jobs report
10:16 OK, sold 1422 stop 1425
10:08 looks like trade time may be a low, but trading both side of the 110 EXMA
9:52 to me this looks like a flat to up day
9:46 common on Fridays for the first move to be a head fake
9:36 dipped down to 110 EXMA
9:32 outcry session open
9:24 Sometimes one can trade the jobs report. One needs to use 24 hour data. The ADP jobs report sparked a rally yesterday.
Overnight the market conjested in a flat region. Prior to the BLS report, a two hour resistance at 1424 was evident.
I placed a buy stop at 1424.5, got filled at 1424.75, then covered at 1429.5
9:14 on the MTRainbow chart, the white 440 EXMA is up, so the day trend is up
9:12 today's hotline trades are at 10:22 and 12:55
8:42 good jobs report sparked a good rally - this was foreshadowed by yesterday's ADP jobs report
see Economic News link on left side of ListOfCharts page
8:20 Good Morning. Welcome to the Chaos Clinic. This site has a lot of charts,
so you may find it useful to have several of them available within your
browser. If you have a tabbed browser, you can open separate charts
in separate tabs by right clicking on any link, and selecting "open in new tab"
from the menu. The main list of site pages is at
http://daytradingforecasts.com/chartlistsec.asp
Recommended pages to watch are SPKISS, MTRainbow, and Chat.
For astro stuff, add SPSunMoonMer, Wheel, and Chaos Clinic.
Chaos clinic comments appear at the bottom of the SPKISS, MTRainbow,
and ChaosClinic pages. Comments in the chat room are announced by a
"duck call" noise. This noise also occurs when the sofware detects a
resonant hex pattern on the Wheel page. Trading tutorials
are on the right side of the ListOfCharts page. One should
read Trading the MoonTide Tutorial and Keep it Simple as a minimum.
9:00 Eastern-System: No comments