![]()
![]()
********************************************************************************
젨젨쟋oon And Sun Rally The S&P
젨젨잺haos Clinic for 11/8/2019
********************************************************************************
Last weekend when I perused this week with my graphical ephemeris, looking for
Moon transits that might move the S&P, I noticed one interesting one near 2:00 Eastern on
November 7th. It was a transit that I have seen near major tops many times. I look
for times when high energy harmonic moves could occur.
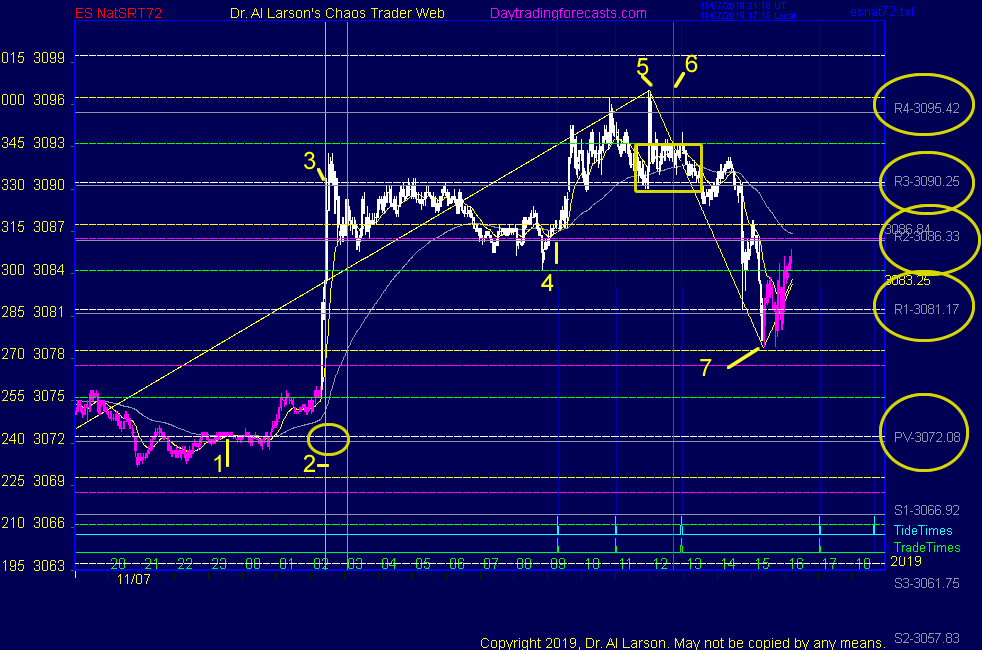
This chart shows how it turned out. This chart is the esNat72 chart from the
Secret page on daytradingforecasts.com. That site is available to subscribers
of my Tomorrow's Market Hotline Email.
The scale on the left of this chart is scaled to a Wheel of 72 points per circle.
The left column of numbers are the degrees corresponding to price. For example,
prices moved from about 240 degrees to 0 degrees, above which the scale repeats.
The horizontal axis is a 24 hour session with 24 hour time marked as Eastern.
There are two sets of horizontal lines on the chart, vibration levels, and pivot
prices. the vibration levels are 4 sets of lines, white, green, magenta, and white.
Each set of lines repeats every 9 points, the eighth harmonic of 72.
The pivot prices are labeled on the right of the chart, as S4,S3,S2,S1,Pivot,R1,R2,R3, and R4.
These prices are computed from the prior day's data, and represent harmonic levels that
connect today's prices with the prior days. These levels are widely used by computer trading algos.
Near the bottom of the chart are two lines of "pippers" for the MoonTide TideTimes and TradeTimes.
Also shown on the chart are vertical lines representing times of significant Moon activity.
The position and number of these lines varies every day as the Moon moves.
I have put numbers on the chart for descriptive purposes. These have nothing to do with any method
of wave counting.
For the first six hours prices traded near the Pivot price, at point 1. This was along a white
vibration level. Then at point 2, prices shot up 2 white levels to 3. This is an 18 point move,
one fourth of the Wheel of 72. It also corresponded to a move from the pivot price PV to R3.
From there prices congested between R2 and R3 until the normal session open at point 4.
In the normal session, prices rallied up two yellow levels to point 5. En route prices made a small "three
drives to a top. " The last drive was a vertical move from the white level to the yellow level,
basically up 9 points from the yellow level near point 4. Within minutes, prices dropped back below the
green level. Then for over an hour prices traded withing the yellow box.
This action is "range halving." It is a form of frequency doubling, a well known precursor to chaos.
That suggested that the vertical green line at 6 could reverse the trend. That is what happened,
as prices dropped two yellow levels to point 7. The move down was again an 18 point move,
one fourth of the Wheel of 72.
The evening news said the rally was due to news on US-China trade negotiations.
But my research says there are hidden forces at work.
The move at 2 and 3 was a Moon influence. Point 5 was exactly when the Sun passed over the New York
Stock exchange. So the Moon and Sun provided the energy for the rally.
It was the earth's electric field and the rules of harmonic energy addition that were the
hidden forces.
For more on my work, see Moneytide.com
11/8/2019 2:02:56 PM MT Al****:: have a good weekend everyone
11/8/2019 1:58:35 PM MT Al****:: I haven't channged the guide lines, but the Chaos Clinic page gives pretty good signals with the bar coloring
11/8/2019 1:49:50 PM MT TP:: And with the new tweaks does that mean we don't have to take trades within 45 minutes of the trade time but we can do it closer to the actual trade time?
11/8/2019 1:43:01 PM MT TP:: What kind of tweaks did you make? I'm curious.
11/8/2019 1:38:39 PM MT Al****:: just some tweaks
11/8/2019 1:29:53 PM MT zz:: Al have you refinded your calculation program for the turning points, in the last 7 years. The reason I ask is that they appear to be much more accurate than they were. I was with you about 7 years back and they seem a lot better now.
11/8/2019 1:11:18 PM MT Al****:: you need a magnifying glass to see it :)
11/8/2019 12:47:56 PM MT qq:: Al I believe you're right
11/8/2019 12:46:26 PM MT qq:: But price firming and slight up leaves me neutral
11/8/2019 12:45:17 PM MT Al****:: best fit is red -Tide , so maybe small up
11/8/2019 12:40:39 PM MT Al****:: LOL
11/8/2019 12:40:05 PM MT qq:: I'm guess a small break down
11/8/2019 12:37:58 PM MT qq:: Boring market, but last 30 minutes it might break.
11/8/2019 11:44:51 AM MT Al****:: bew: I need to understand how srteemit works. At a glance, you get paid for my content, but in a cryto currency, which may or may not have value. Is there any way to track hits? Also, I need to know who you really are, so send me an email. I presume you are in my database
11/8/2019 11:19:29 AM MT bew:: AL: I see that GON has posted your weekly article on www.fxstreet.com. may i have your permission to post the weekly articles on my steemit.com blog?
11/8/2019 10:27:23 AM MT Al****:: Good. Then you know what to do. Good luck.
11/8/2019 10:24:39 AM MT JK:: I have your course Al and the fractal overlays thank you
11/8/2019 10:23:51 AM MT Al****:: You are welcome
11/8/2019 10:20:52 AM MT JK:: Thank you AL for your reply
11/8/2019 10:09:38 AM MT Al****:: I use my emylar overlays to project possible moves ahead.
I have placed a Fractal of Pi chart in the Certified Chaos Trader's Room. That room is open
to graduates of my 4 main courses. See http://moneytide.com -> Courses for details.
eMylar Fractal of Pi overlays help you be patient, since they show you future potential moves.
The best bargain in my courses is to take the Cash In On Chaos and Fractal of Pi courses and
learn to use the FOP overlay. Then take Chaos Trading Made Easy, and finish with Face Of God.
11/8/2019 10:02:18 AM MT Al****:: JK: today is lifeless so far, and may remain so. Friday aftenoons tend to be dull if the morning is dull. All of this goes with the Moon near 0 degrees. So may not get a new high today.
Tops take 3 days or more to confirm. So far the SPY has not turned any of my Rainbow of averages down. Next week will tell.
I do see weakness in the Russell due to a high on Tuesday and a lower high on Thursday, but more data is needed to confirm a top
11/8/2019 9:15:22 AM MT JK:: Top today Al for the year do you think or are we going to 3100 today. Whats your thoughts.
11/8/2019 7:54:00 AM MT Al****:: Thanks GON. Yes, those hidden forces: mechanical engineers seee their levers, gears and ropes. Electrical engineers never see the electrons; But we accept cell phones, computers, etc but most never realize it all electrons moving in one huge universal electric field
Hope you are better
11/8/2019 7:46:20 AM MT gon:: Thanks for the article Al, it has been published https://www.fxstreet.com/analysis/moon-and-sun-rally-the-sp-201911081443 Hope you recover well. I've been down a bit the last months but thanks to planetary correspondences I could find things out that doctors didn't see. A little bit like you say in the article, "...there are hidden forces at work."
11/8/2019 7:45:08 AM MT qq:: Good Morning
11/8/2019 5:59:39 AM MT jvj****:: Good morning
11/8/2019 5:27:51 AM MT Al****:: GM all. Good luck today.
Chaos Clinic is posted on the AUX page.
9:00 Eastern-System: No comments
![]()
![]()