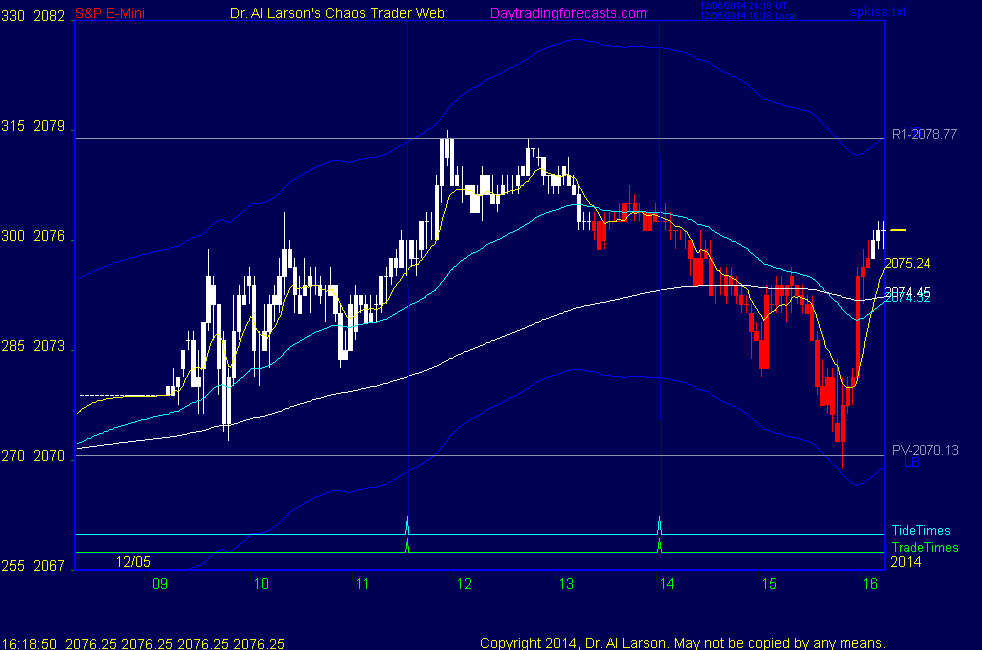


12:57 I'm going to call it quits. On a day like today +3 is good. Thanks for coming. See you next week. Take a course or two.
12:56 taking +3 on the stall
12:55 stop to 2076, lock 1.5
12:47 in the EXMA rainbow, the trend usually holds until the 55 minute EXMA turns; stop to 2075.5 lock 1
12:37 stop to 2075, lock .5; stop at the 220 minute EXMA
12:29 poor volatility; I'll try to hold this trade into next trade time, but I'll not take another trade
12:26 stop to 2074.5, break even
12:18 took a break to take the dogs to the park; stop to 2073.5, risk 1
11:52 stop to 2072.5 - risk 2; putting cover limit order at 2087 for now
11:31 stop to 2071.5 - reduce my risk to 3 points
11:30 yesterday about this time we got a 15 point popup
11:25 I sense some juice coming; fast EXMAs curling up
11:19 if I were not already long I would be buying here as per the hotline trade
11:16 I now have an intraday Stargo pattern suggesting the same thing; but forecasts need to be tracked by EXMAs,
so watch them
11:04 looks like we could get a rally as per the green +Tide
10:58 getting a little dip - possible continuation buy setup; I'm just holding
10:44 soon come into the first hotline trade window
10:36 I have placed a Fractal of Pi chart in the Certified Chaos Trader's Room. That room is open
to graduates of my 4 main courses. See http://moneytide.com -> Courses for details.
eMylar Fractal of Pi overlays help you be patient, since they show you future potential moves.
The best bargain in my courses is to take the Cash In On Chaos and Fractal of Pi courses and
learn to use the FOP overlay. Then take Chaos Trading Made Easy, and finish with Face Of God.
10:25 I found this tendency by taking my own Chaos Trading Made Easy course and doing the homework in it
10:22 there is a strong tendency that when yesterday has a low in the last hour, and prices hold up,
buying comes in after 10:00 today
10:16 here I'm just watching the Rainbow of EXMAs; as long as they keep diverging, trade looks good
10:13 if we get some juice, we could rally to 2087,
10:09 doing some backing and filling; rainbow is up; stop is good; wait
10:03 that initial rally was due to green swan, which encouraged me to jump in
9:56 That dip did not reach the pivot price of 2070.13, getting stopped by the 440 minute EXMA; this is good
9:53 looking better
9:46 stop OK, but I should have waited
9:33 no hotline trade for 2 hours; there is buying above the pivot price so I'm buying 2074.5 stop 2070 based on EXMA rainbow
9:32 this looks like an up day
9:28 this is a bit surprising given the strong employment report but hey, markets are chaotic, not logical
9:23 the trades today are 11:33 and 14:02 ; low volatility so far
9:00 Good Morning. Welcome to the Chaos Clinic. This site has a lot of charts,
so you may find it useful to have several of them available within your
browser. If you have a tabbed browser, you can open separate charts
in separate tabs by right clicking on any link, and selecting "open in new tab"
from the menu. The main list of site pages is at
http://daytradingforecasts.com/chartlistsec.asp
Recommended pages to watch are SPKISS, MTRainbow, and Chat.
For astro stuff, add SPSunMoonMer, Wheel, and Chaos Clinic.
Chaos clinic comments appear at the bottom of the SPKISS, MTRainbow,
and ChaosClinic pages. Comments in the chat room are announced by a
"duck call" noise. This noise also occurs when the sofware detects a
resonant hex pattern on the Wheel page. Trading tutorials
are on the right side of the ListOfCharts page. One should
read Trading the MoonTide Tutorial and Keep it Simple as a minimum.
9:00 Eastern-System: No comments