

1:54 Thanks for coming. See you next week. Take some courses. See the special on http://moneytide.com
1:52 that's my day trade. May be more but I'll let my swing trade get it.
1:51 took +3
1:50 my patience is waning
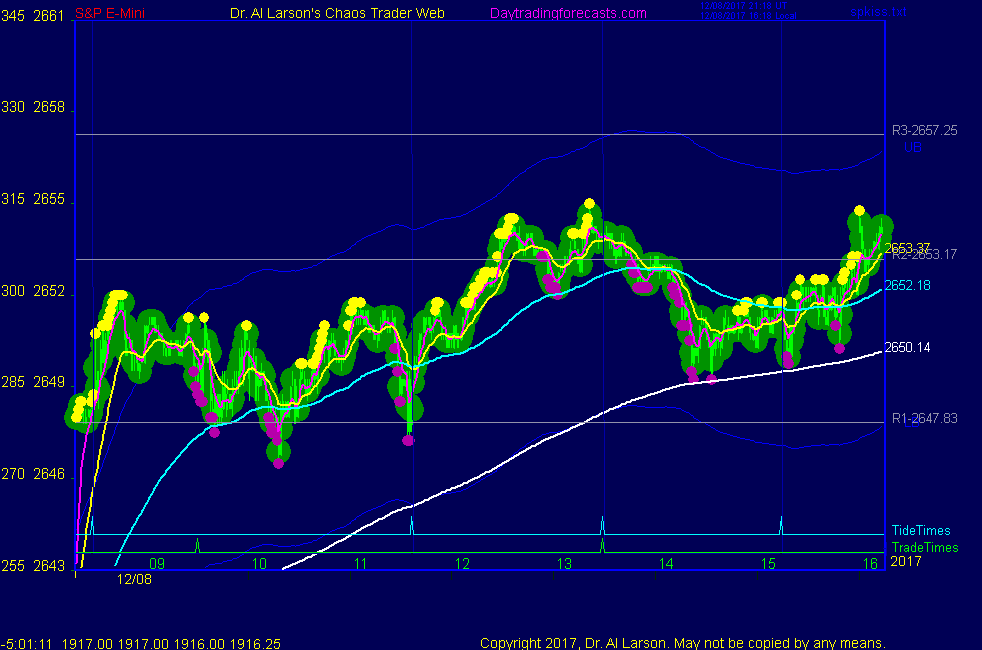
1:33 my cover stop is at 2658. On the esNat72 chart, there is a white vibration line at 2658.5,
which is the 18 point range for the 24 hour day
1:26 moving my stop up to 2651.25, just under my 220 minute EXMA
1:18 It takes patience to hold to close. To help, I like to play some gospel music
It reminds me that all I've learned was given to me by a greater power
1:13 This little up move is part of the Fractal Grid pattern.
1:02 pulling back to test the 2652 level-earlier resistance, now support
12:54 on my AUX page the cyan cycle is up, and the line is straight; one can draw a line extending it
to see how high the rally could go. A great tool for drawing on your screen is Epicpen Pro from Tank Studios.
12:44 stop to 2650.5, lock one point
12:42 updated my Fractal Grid chart in the CCT Room.
12:37 this is now a "hold to close" pattern; may cover a little earlier
12:29 love the Mercury-Moon juice; stop to 2649.5, break even
12:16 I'm just going to carry this trade to close; moving cover sell limit to 2658
12:13 here comes the Moon trine Mercury energy
12:00 Yesterday I collected some Bitcoin data and set up a daily chart, generated an XGO and ZGO forecast.
So I was amused last night when the national news talked about Bitcoin and how one guy had made a lot of money.
December 18 the CME will start trading Bitcoin futures. That will be interesting. Bitcoin is a mythical currency.
It only has value when someone will give you real currency for it. Definitely not an investment.
I think it is the Mortgage Backed Security of this bull market.
11:57 my Daniel chart on Secrets page shows resistance 2651.5 through 2653. Need to get through it to
really move.
11:52 prices have held up well, so rest of the day should be up
11:42 the Fractal grid is the best tool I know of to keep you steady in a sideways market
11:37 I have placed a Fractal Grid chart from Chaos Trading Made Easy in
the Certified Chaos Trader's Room. That room is open
to graduates of my 4 main courses. See http://moneytide.com -> Courses for details.
eMylar Fractal of Pi overlays help you be patient, since they show you future potential moves.
The best bargain in my courses is to take the Cash In On Chaos and Fractal of Pi courses and
learn to use the FOP overlay. Then take Chaos Trading Made Easy, and finish with Face Of God.
11:30 back - see still trading flat; sitting tight
11:12 trades is on, orders are in. Taking a break to take the dogs to the park.
11:05 the Mercury Moon cycle is 40 days. It is the most common cycle mentioned in the Bible.
10:57 may get some juice near 12:00 as the Moon trines Mercury
10:50 putting a sell limit order at 2655.5
10:43 now I'm looking for a 9 point move off of 2646.5, or 2655.5
10:38 I only wanted to trade with the trend of my chart on the AUX page. I knew picking an
entry would be hard. But for now I'm happy being long in a flat to up market.
10:33 back up to my entry ; stop was in good place thanks to esNat72
10:22 stop OK so far
10:09 sitting tight
9:55 bought 2649.5 stop 2646; saw support on R1, bought
the white vibration level on esNat72, stop under the yellow level
9:48 treading water on R1
9:44 trend is up, so I do not want to sell. Need to be patient.
9:39 this may be a case of "Gap up. buy a low near 11:00 Eastern"
9:38 just watching
9:35 twitching
9:27 lower minor high
9:22 prices topped on a Mars electric filed flux line. R2 prices at 2653 are above it,
but we may pull back to R1 2646.
9:16 I suspect many knew the employment report would be good, so bought yesterday and covered after the news as out.
9:10 a 9:31 trade time means join a trend in progress. In this case I want to see a pullback for a day trade.
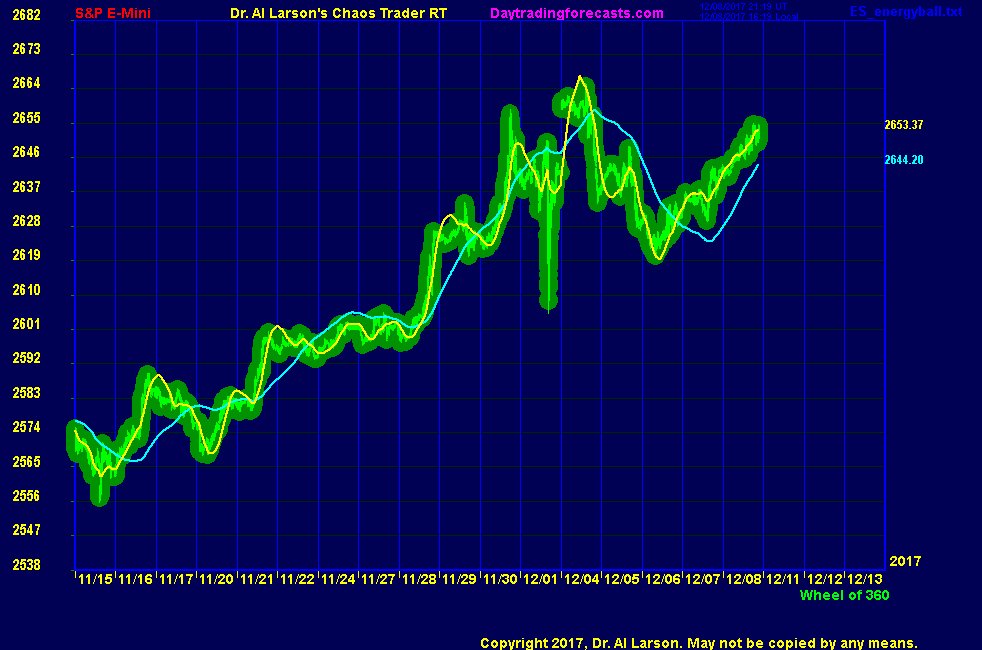
8:56 On the AUX page is my multiday plasma chart. The most notable feature of it is the spike last Friday
and the weekend gap up, followed by the Monday-Wednesday ABC. On Thursday contracts rolled over. Prices
dipped until the start of the normal session, where the first big volume comes in. I bought the higher low.
On my Daniel chart my cyan cycle was turning up. A trend line under prices suggested the magor trend was still up.
That trend line moves 9 points every 2 days. Note my chart has prices marked every 9 points. That is because the
Moon works on a Wheel of 72 points. The 8th harmonic of that is 9 points.
8:39 today's market is up sharply overnight. This may make it hard to get in on the rally, but
the trade times of 9:31 and 13:29 may give a decent setup. I am in a multiday swing trade from
yesterday, which I entered based on my Daniel chart in the Secret section.
In that section the esNat72 chart showed that prior to the Employment report prices had made a 9 point
white to white move, then pulled back to the Magenta line at 2645.5. Odds favor reaching the next magenta line up.
8:37 Good Morning. Welcome to the Chaos Clinic. This site has a lot of charts,
so you may find it useful to have several of them available within your
browser. If you have a tabbed browser, you can open separate charts
in separate tabs by right clicking on any link, and selecting "open in new tab"
from the menu. The main list of site pages is at
http://daytradingforecasts.com/chartlistsec.asp
Recommended pages to watch are SPKISS, MTRainbow, and Chat.
For astro stuff, add SPSunMoonMer, Wheel, and Chaos Clinic.
Chaos clinic comments appear at the bottom of the SPKISS, MTRainbow,
and ChaosClinic pages. Comments in the chat room are announced by a
"duck call" noise. This noise also occurs when the sofware detects a
resonant hex pattern on the Wheel page. Trading tutorials
are on the right side of the ListOfCharts page. One should
read Trading the MoonTide Tutorial and Keep it Simple as a minimum.
9:00 Eastern-System: No comments