

3:39 OK, I'm done. Thanks for coming. See you next week. Take some courses
3:36 covered for +6
3:33 need to get past this correction
3:28 stop to 2006
3:26 stop to 2007
3:16 stop to 2009.25
3:10 putting buy limit at 1995l; stop to 2011
3:09 stop to 2013
3:06 looks like this is it
3:00 last hour whoosh probable
2:47 I have a Face of God pattern indicating lower prices
2:42 looking OK
2:26 OK, I'll stay-sold 2009.25 stop 2018
2:21 I may have flinched; Think I'll call it a day; not feeling well and much to do
2:17 aborted -5 ;
2:05 I just had an urge to cover, so it must be ready to go down :)
1:57 this trade is taking the patience of Job -if it stays viable I'll carry it through next trade time
1:46 hex pattern recognized by software-signifies stable areas and 12 point quantums
1:43 still congesting-trade still viable
1:30 stop is where it should be
1:20 got above 110 but not 220
1:09 what was support at 2011.25 is now resistance
1:05 holding fast
12:52 small congestion; the 20 minute EXMA stayed flat; stay short
12:42 need to be patient - the longer EXMAs are down
12:25 I will try to ride this trade into the next Tide Time
12:23 a regression channel suggests about the same
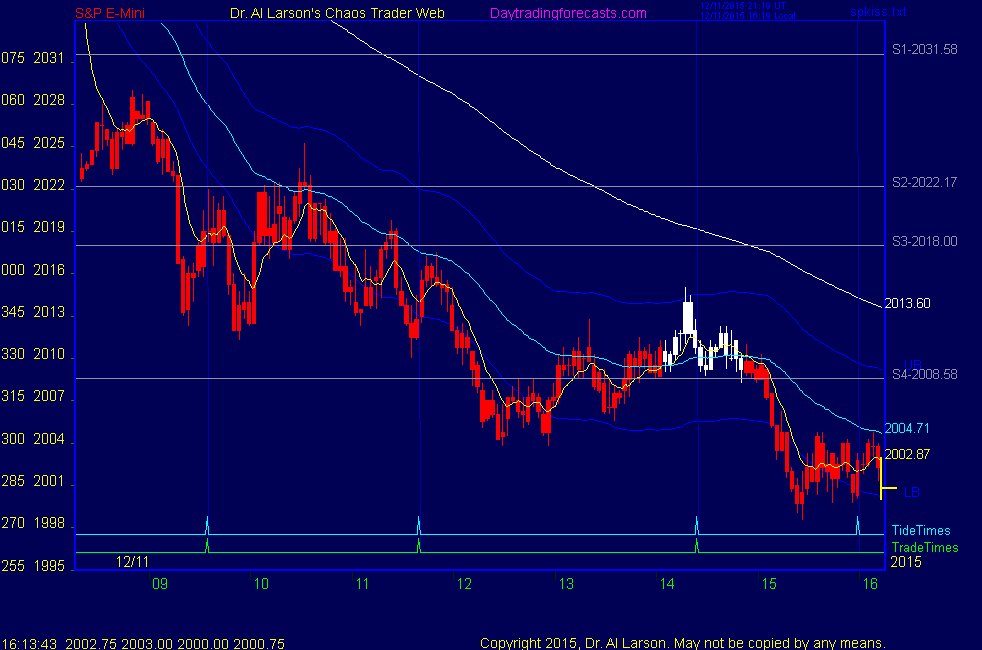
12:21 doubling of early range targets 1993.5 !
12:18 trend is down-attempt to rally failed
12:10 broke support-sold 2008.5 stop 2016 for now
12:07 getting support on Green Swan
12:01 we do have a Green Swan coming up soon
11:57 watching for a higher low here-some indication of an up Chaos Clamshell
11:50 we now have a "3 drives to a bottom" pattern -may rebuy
11:45 low exactly on TideTime
11:40 Got wacked- I was too aggressive
11:19 bought 2017.50 based on candles-and 20 EXMA curled up-stop 2011 for now
11:17 watching for a buy entry
11:13 possible double bottom
10:55 now tracing red -Tide; suggests low at next trade time
10:42 looks like decline is over-now expect flat to up
10:04 OK, stopped out for -.25 ; taking a break
10:00 looking good-9 point cover is 2009.75
9:55 stop now to 2019, at the 55 minute EXMA
9:50 stop to 2022
9:45 looking OK
9:38 stop 2024 now
9:37 sold 2018.75 stop 2030.25 for now
9:35 possible continuation sell setting up -trend is down so only sell
9:31 outcry session open, in the first trade window-will watch a bit
9:27 on my TeamViewer NinjaTrader chart we can see that a Red Swan started the decline and is driving it
9:22 stalled at S2=2022; broke s3 at 2018; s4=2008.5
9:21 hard to get an entry in this kind of move
9:19 resumption of selling
9:11 Team viewer ID m11-362-212
9:08 momentum of the overnight decline has waned-may get an early rally attempt: trade times 09:35 11:40 14:24
8:40 Economic reports had minimal impact on prices after sharp overnight decline
8:20 Good Morning. Welcome to the Chaos Clinic. This site has a lot of charts,
so you may find it useful to have several of them available within your
browser. If you have a tabbed browser, you can open separate charts
in separate tabs by right clicking on any link, and selecting "open in new tab"
from the menu. The main list of site pages is at
http://daytradingforecasts.com/chartlistsec.asp
Recommended pages to watch are SPKISS, MTRainbow, and Chat.
For astro stuff, add SPSunMoonMer, Wheel, and Chaos Clinic.
Chaos clinic comments appear at the bottom of the SPKISS, MTRainbow,
and ChaosClinic pages. Comments in the chat room are announced by a
"duck call" noise. This noise also occurs when the sofware detects a
resonant hex pattern on the Wheel page. Trading tutorials
are on the right side of the ListOfCharts page. One should
read Trading the MoonTide Tutorial and Keep it Simple as a minimum.
9:00 Eastern-System: No comments