********************************************************************************
AstroPhysics Of A Possible S&P Top
Chaos Clinic For 12/13/2024
********************************************************************************
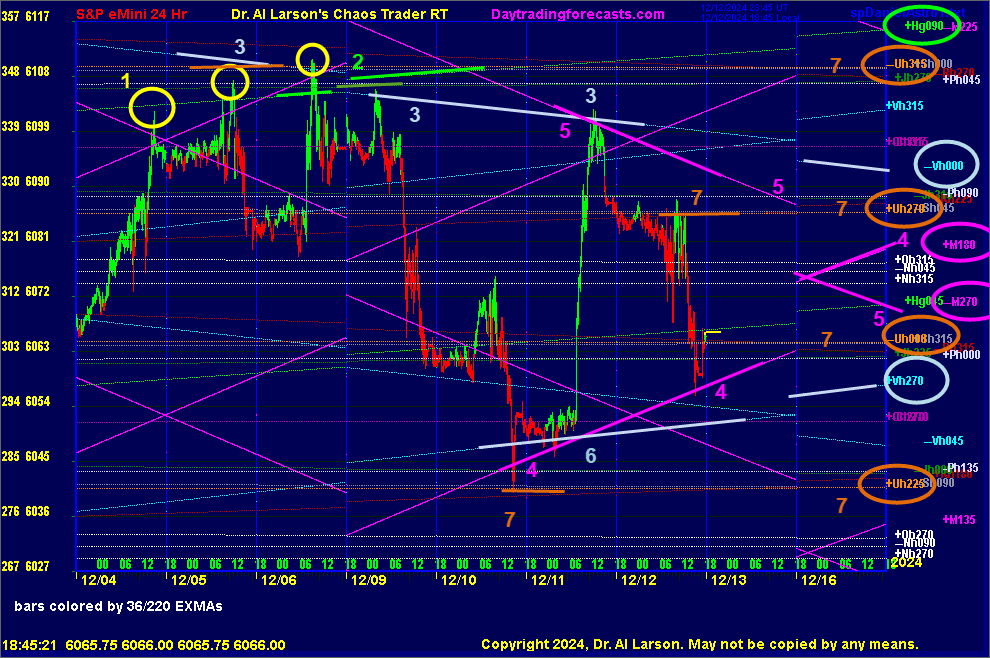
This chart of the S&P futures shows the past 7 trading days, and the next two
days. Also on the chart are multiple electric field flux lines, on a wheel of 360.
Points of interest are shown with colored numbers, with nearby flux lines marked
in the same color. Bars are colored green or red by the 36/220 minute EXMA crossovers.
Starting with 1, the three yellow circles show a "Three Drives To A Top" pattern.
This warned of a change in trend over the weekend. On Saturday the 7th, Earth
conjoined Jupiter. finishing a Mercury, Earth Jupiter three planet conjunction
that started on the 6th. This cycle is 112 calendar days long.
This conjunction shows up at 2, where the bright green line Hg090 crossed the
dull green line +Jh090. Nearby the Venus -Vh000 flux stopped the rally on 12/6/24.
This is line 3, which also stopped the rally on the 9th. Prices dropped
sharply on the 9th, and continued down on the 10th to support on the Uranus +Uh225 flux,
On the morning of the 11th the Mercury (4) flux and Venus (6) provided support ahead
of the CPI report. That report sent prices sharply up, all the way to the Venus -Vh000
flux (3). Also there was the Mercury -M270 flux (5).
From there prices dropped on the 12th, to the Mercury +Mh180 (4). This trap between
the up and down Mercury flux will change on the 16th, when they cross.
If prices trade below that cross next week, the decline could continue.
A quarter MEJ cycle would be 28 calendar days. From the 12/6/2024
high, this would be 1/3/2025.
For more on my work and to subscribe to Tomorrow's Market Email Hotline and access to daytradingforecasts.com see
Moneytide.com
Software to plot electric field flux lines in NinjaTrader is available at
energyfieldtrading.com

12/13/2024 1:10:39 PM MT Al****:: I'm going to call it a day-thanks for coming-see you next week-take some courses
12/13/2024 12:58:23 PM MT Al****:: may be time for that "more down"
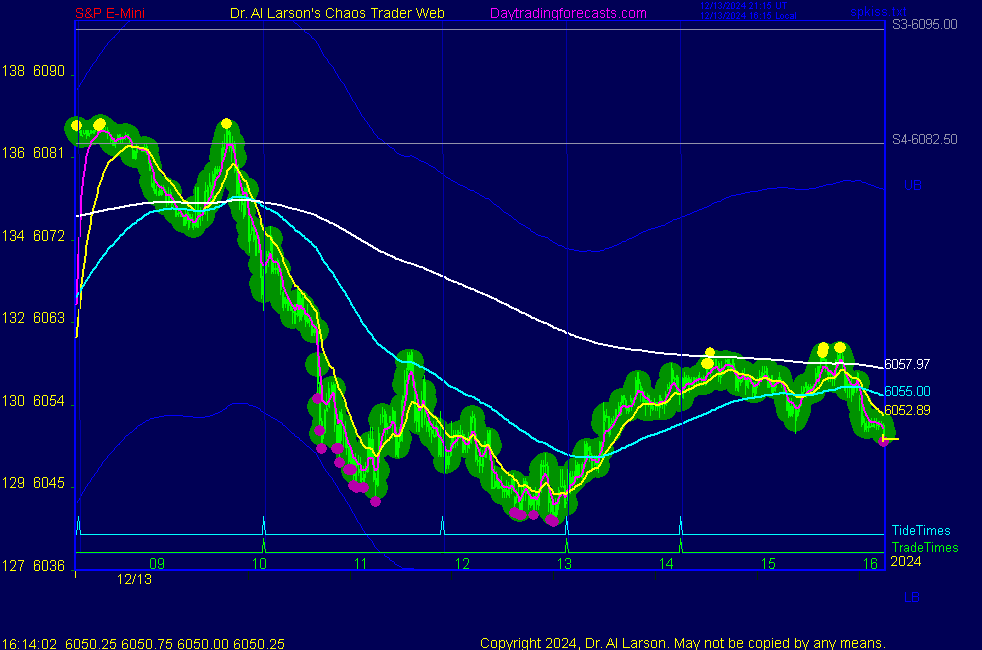
12/13/2024 12:16:26 PM MT Al****:: today we have a correction according to the 20, 110, and 220 EXMAs,
but the 440 remains down. That suggests more down when the 220 and 110 turn back down.
12/13/2024 12:07:51 PM MT Al****:: the EXMAs are most uesful if one uses a rainbow of them and looks
at the convergence and divergence of them. That is what is in MACD.
I prefer just watching a rainbow. For example, on SPKISS page, chart 3.
today started with a convergence, then diverged as prices fell,
then near the 13:00 trade time, started converging. This shows the thrust-correction pattern.
12/13/2024 11:58:50 AM MT Pal:: Got it, thanks
12/13/2024 11:56:38 AM MT Pal:: Sorry, your answer overlapped mine
12/13/2024 11:55:08 AM MT Pal:: Ok, understand that. But are the EXMAs computed with a period of say 110 bars or minutes (I thought that was minutes as that's mentioned on the footnotes SPKISS Chart 3) If minutes, I would get that almost correct if using a 37 bar period (my EMAs can do only bar counts)
12/13/2024 11:50:38 AM MT Al****:: in most systems the EXMAs are computed from the candle data,
so a 20 minute EXMA on 3 minute bars is 20/3=6 bars. This is a bit rougher than my way of doing things
12/13/2024 11:47:59 AM MT Al****:: yes, EMA and EXMA are the same. Different systems will give different results depending on differences in the data used, like 24 hour versus spliced 8 hour and using bars and not minutes. My data is collected in one minute bars and I use that to compute my EXMA's, separate from my 3 minute candles
12/13/2024 11:25:58 AM MT Pal:: Al, sorry if that's a really dumb question.
Is your EXMA the same as an EMA? I understand the periods are "minutes" not bars, but I get slightly different results on a two minute chart than yours .. Thanks
12/13/2024 8:56:46 AM MT Al****:: swing traders can now use that level as a stop guide
12/13/2024 8:55:33 AM MT Al****:: I did not discuss point 7 on the Chaos Clinic chart
those are the Uranus electric field flux-The outer planets are
the strongest so I was watching to see if the +Uh270 flux would stop the overnight rally-it did
12/13/2024 8:20:14 AM MT Al****:: chart 3 on SPKISS shows first MoonTide trade a sell
12/13/2024 6:49:25 AM MT Al****:: Good Morning visitors. Welcome to the Chaos Clinic.
The written Chaos Clinic is on the AUX page.
This site has a lot of charts,
so you may find it useful to have several of them available within your
browser. If you have a tabbed browser, you can open separate charts
in separate tabs by right clicking on any link, and selecting "open in new tab"
from the menu. The main list of site pages is at
http://daytradingforecasts.com/chartlistsec.asp
Recommended pages to watch are SPKISS, MTRainbow, and Chat.
For astro stuff, add SPSunMoon, Wheel, and Chaos Clinic.
A special set of Dr. Al's research charts are on the Secret page.
Comments in the chat room are announced by a
"duck call" noise. This noise also occurs when the software detects a
resonant hex pattern on the Wheel page. MoonTide trading tutorials
are on the right side of the ListOfCharts page. One should
read Trading the MoonTide Tutorial and Keep it Simple as a minimum.
Many subscribers do not strictly trade the MoonTides, but use the charts on this
site as input to their own trading strategies. For example, charts 5 and 6 on the
SPKiss page are a good starting point for swing traders.
Also on this site is the Certified Chaos Trader's Room. That room is open
to graduates of my 4 main courses. See http://moneytide.com -> Courses for details.
12/13/2024 5:29:23 AM MT oag****:: Good morning everyone! Hope everyone has a prosperous day!
9:00 Eastern-System: No comments