
Chaos Clinic Recap

Here are Al's comments
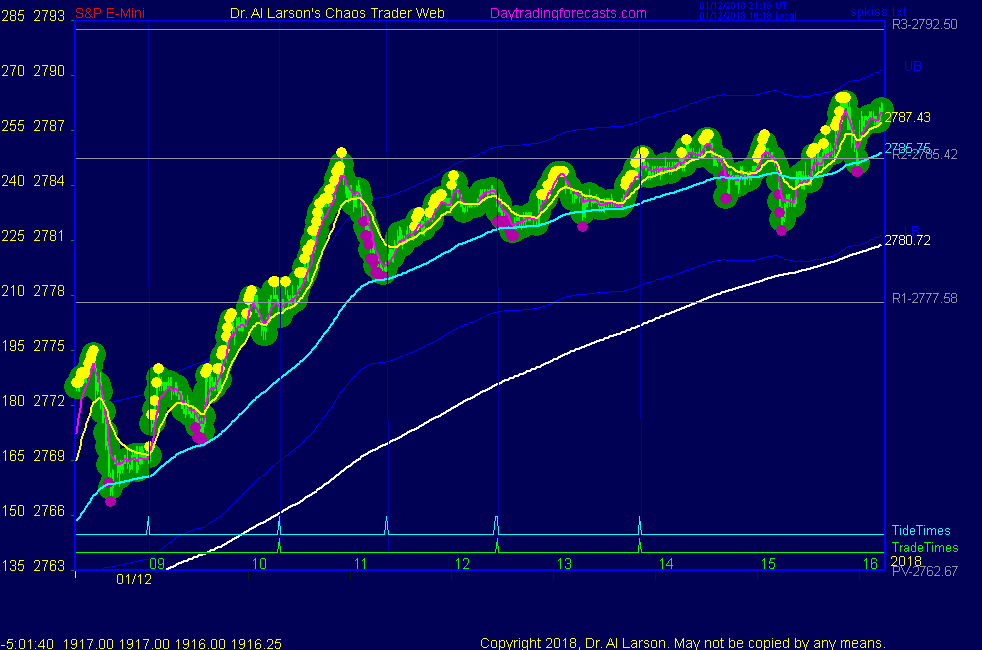
Chaos Clinc For 1/12/2018 - Beyond MoonTides
This is the live chat session from 1/11/2018, where I demonstrated to
Certified Chaos Trader TG how I used the Rainbow of EXMA's to buy early
and hold all day. The comments are latest on top, so read them bottom up.
The chart is on the AUX page. Thanks to TG for sharing his views.
1/11/2018 2:25:23 PM MT TG****:: You talked me back in for a couple more. Worth the price of admission ;)
1/11/2018 2:24:23 PM MT TG****:: Good night AL
1/11/2018 2:17:28 PM MT Al****:: may get the 2771.5 after hours
1/11/2018 2:15:09 PM MT Al****:: covering 2769.5
1/11/2018 2:02:40 PM MT Al****:: stop 2765
1/11/2018 2:00:01 PM MT Al****:: will hold until futures close 16:15
1/11/2018 1:54:29 PM MT Al****:: stop 2763
1/11/2018 1:54:11 PM MT TG****:: NICE !!!
1/11/2018 1:51:09 PM MT Al****:: resonant streak at 16:00 to match one at 10:00
1/11/2018 1:24:30 PM MT Al****:: stop to 2762; still hoping for R4
1/11/2018 1:17:27 PM MT Al****:: final rally under way
1/11/2018 12:58:03 PM MT Al****:: stop to 2761
1/11/2018 12:53:33 PM MT Al****:: hanging tough; this is a cover on close pattern
1/11/2018 12:31:39 PM MT Al****:: looks like congestion ending
1/11/2018 12:19:10 PM MT Al****:: squatting on the 110
1/11/2018 11:49:22 AM MT Al****:: small congestion; no selling; have sell limit 2771.50 order in
1/11/2018 11:41:40 AM MT Al****:: stop to 2760; yes; I watch the Rainbow and see which
EXMA is never touched an use that one as a stop guide; on high volatility days it is usually the 220
1/11/2018 11:26:25 AM MT TG****:: The 110 by itself isn't always a great support level
but it is in certain situations. When there is a gap up beyond the range of the prior day's regular trading hours,
the 110 is often good support.
1/11/2018 11:26:08 AM MT Al****:: OK; because of the volatility,
I'm using a buy and hold strategy for the day . Stop now 2759.5 under the 220 minute EXMA
1/11/2018 11:24:10 AM MT TG****:: If we looked at the support and resistance levels
of the moon flux lines on the wheel of 72 today and paired them up with other support and resistance on our chart,
for instance the 110 EXMA this morning and its upper OOB level this afternoon, we'd have gotten a great entry
and exit level.
1/11/2018 11:18:26 AM MT Al****:: the last chart on the SPKISS page shows moon flux on
the scale of 360; note this rally is running up the +T000 Moon flux
1/11/2018 11:16:56 AM MT Al****:: right now I'm watching Wheel of 360 stuff ; on that
scale Moon moves about 15 points per day, which is what created the 18 point
daily moves last week
1/11/2018 11:12:49 AM MT Al****:: those labeled Txxx are; on wheel of 72
1/11/2018 11:05:54 AM MT TG****:: Do you call the horizontal, gold dotted lines on the
first chaos clinic moon flux lines?
1/11/2018 11:03:14 AM MT Al****:: I like to draw a line along the 220 minute EXMA as a guide
1/11/2018 11:01:57 AM MT Al****:: high volatility days usually run to the close-I just watch the EXMA rainbow
1/11/2018 11:01:25 AM MT TG****:: I didn't have a great entry. Bought almost begrudgingly.
Took 4 points when price failed to close above the OOB level on the first few attempts.
1/11/2018 10:56:17 AM MT TG****:: This could drop like a rock from here and still prove that high volatility forecast correct. ;-)
1/11/2018 10:52:43 AM MT Al****:: look at the line on the bottom-the big humps are the high volatility days, roughly once a week
1/11/2018 10:51:57 AM MT TG****:: 2764.5 is at the 90 point band level. Up over it slightly and backing off a little.
1/11/2018 10:50:06 AM MT TG****:: How do you read that chart, ESNat360, as a volatility forecast. I must have missed that lesson.
1/11/2018 10:46:29 AM MT Al****:: may exceed R4
1/11/2018 10:36:24 AM MT Al****:: Note the volatility forecast on secret ESNat360 shows high volatility today
1/11/2018 10:31:23 AM MT Al****:: last week the movement was 18 points per day
2 days is 36 points; 2736+18+18=1272
1/11/2018 10:29:03 AM MT Al****:: looks ready to go; bought R1, may carry; good EXMA rainbow
1/11/2018 10:19:04 AM MT Al****:: That drop was only 25% of the rally; I expected more
1/11/2018 9:57:45 AM MT TG****:: I thought the drop from 2760 two days ago was going to
result in a decent correction, at least 80 points, if not something bigger. At 2755 on Tuesday, price had touched
my double out of band level on my daily chart. 45 points above the 37 day exma is my first oob level (1 std dev),
90 is two std dev. It hasn't happened that often since the late 1990s and the few times it has price reversed
pretty significantly afterwards. Except in early 2000, price got above that band, ran up for 50 more points, then
dropped like a rock and kicked off a much bigger correction.
1/11/2018 9:43:16 AM MT Al****:: FWIW: on my AUX page chart there is a cycle channel marked with
center cyan 2753.15, green bottom (buy)hit by yesterday's lows,
and red top (sell) which is up at today's R4
1/11/2018 9:03:57 AM MT Al****:: rally continues
1/11/2018 8:41:19 AM MT Al****:: some will see it as a double top
1/11/2018 8:27:17 AM MT TG****:: If this morning's high was the top of a bigger two... well that is one deep retracement
1/11/2018 8:26:01 AM MT TG****:: GM everyone
1/11/2018 6:23:59 AM MT Al****:: GM all-good luck today
9:00 Eastern-System: No comments
Besides the comments made by Al, the chat room is has live
comments from other traders who sometimes share their views,
trades and tips. Below are the chat room comments from this clinic
1/12/2018 10:41:02 AM MT Al****:: you too, TG
1/12/2018 9:52:49 AM MT TG****:: Have a great weekend AL
1/12/2018 9:23:55 AM MT Al****:: you know a long trade could be failing when the 50 minute EXMA
turns down. Still may be an up day but the early juice is gone. Because of my late entry I only got +2.5
I'm done for the day.
1/12/2018 9:14:42 AM MT Al****:: computers sold R2 so I did too -
1/12/2018 8:57:41 AM MT Al****:: on the secret -> esNat72 and others, you see 3 vertical lines
white, grey, and brown; these cause confusion, so I've found it
best to wait until after the bast brown one to do anything
1/12/2018 8:42:27 AM MT Al****:: this is a rocket day - hold to close strategy
1/12/2018 8:37:13 AM MT Al****:: bought the breakout
1/12/2018 7:35:15 AM MT Al****:: On the secret page, the ESNat360 chart shows that overnight trading
hit the green vibration line and stalled. The
ESNat72 chart shows trade now within about a 9 point range.
It also shows fast moves both ways inside that range.
That
suggests a sideways market.
1/12/2018 7:06:05 AM MT Al****:: GM all-good luck today. Today's Chaos Clinic is on the AUX page.
It is a lesson on using the EXMA Rainbow on a volatile day.
9:00 Eastern-System: No comments


[ Live Clinics on Friday on DaytradingForecasts.com ]