
2:58 I'm done for the day. Thanks for coming. See you next week. Take some courses.
2:57 I got nervouse when we stayed around the Moon/Venus flux lines
2:54 OK, I'm done for the day-pretty tough, so -1,+2,+2 is good enough for me
2:53 covered for +2 -no juice
2:49 looking for some acceleration here
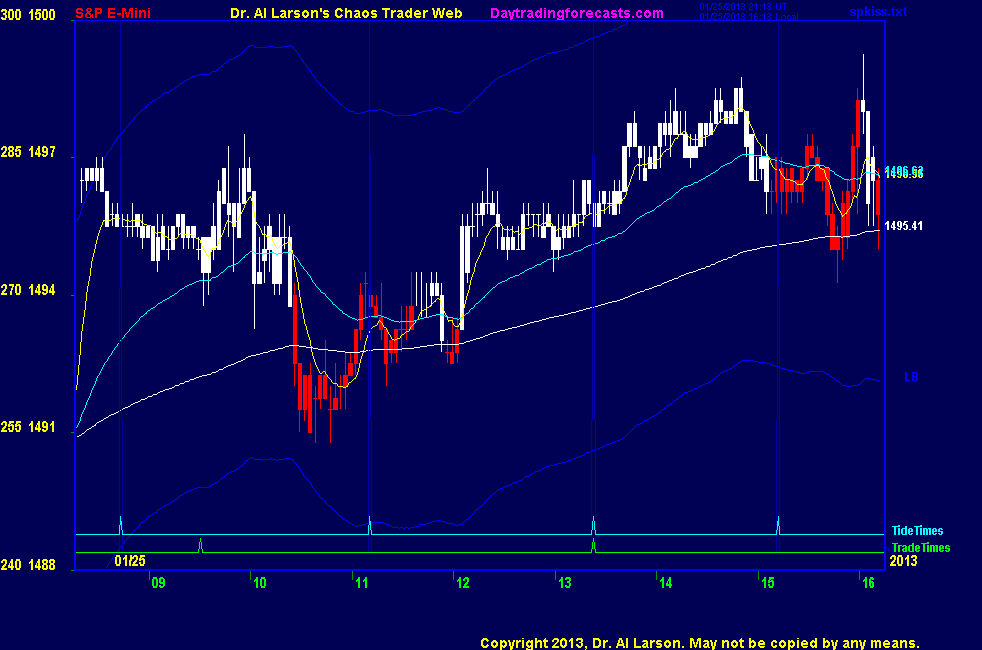
2:46 still OK-got above Venus/Moon flux pair; was resistance, now support; low was on Moon timeline
2:38 stop to 1496.5
2:36 looking good-will try to hold to close , but take 1503 if get there
2:30 I like that we are staying above the 110 minute EXMA
2:21 still not even an 8 point range
2:18 I will cover at next Tide time if still in
2:09 adjusting that to 1503, stop to 1496
2:05 putting sell limit at 1501
2:01 just need to be patient - expect a short covering rally
1:55 stop to 1495.5 -lock a giant .5
1:43 stop to 1495 - break even
1:43 that pole is about 6 points, so may get to 1497+6=1503
1:40 have a little flagpole and pennant pattern off the 12:00 low - last issue of Stocks and Commodities
has an artile about these and how to esitmate a move -here, it pop up go distance of the pole above
1:34 sometimes you have to ask "What is NOT happening?"
the market is NOT selling off
1:32 both 110 and 440 are slowly up, so trend is up
1:28 pattern looks good - just have to wait and be patient
1:20 not exactly a rip roaring day - still stuck on the hex pattern corner
1:17 stop to 1493
1:11 OK, bought 1495, stop 1492
1:07 110 is up, 20 flat, watching for a continuation buy
1:01 having a chart that is fixed size and fills in from left to right is key to using 2 dimensional patterns of
any kind
then, with eMylar overlays, one can overlay a pattern, then just watch it unfold
1:00 updated my FOP chart in the CCT Room
12:50 off the low, I think I see a 1-2-3 now in 4 up Chaos clamshell
12:44 coming into the second trade window ; 110 and 440 are up
12:41 getting another hex pattern notice -corners set by Saturn, Pluto, Chiron
12:28 covering for +2 - pattern there but weak
12:10 looks good- putting sell limit at 1497.5
12:05 I'm watching an overlay of a 5 hour Stargo pattern - it suggests a little rally over next 15-20 minutes
the overlay I'm using would be part of the Stargo course if I do it
12:02 passing solar noon - today looks like a dip into solar noon
11:47 I have added a Fractal of Pi chart to the CCT Room
11:43 stop to 1491
11:36 this is not a hotline trade, but a CTME trade - bought 1493.5 stop 1490.5
11:28 looks like we hold up today-maybe get a late rally
11:20 still holding up - just watching
11:00 on my 2 day charts, I see two rallies of about 11 points, and two declines. Today's decline is much weaker
than yesterday's. Suggests another possible rally - all we need is some juice.
10:56 pretty dull - just watching - next trade time is 13:23
10:46 I have placed a Fractal Grid chart form Chaos Trading Made Easy course in the Certified Chaos Trader's Room. That room is open
to graduates of my 4 main courses. See http://moneytide.com -> Courses for details.
eMylar Fractal of Pi overlays help you be patient, since they show you future potential moves.
The best bargain in my courses is to take the Cash In On Chaos and Fractal of Pi courses and
learn to use the FOP overlay. Then take CTME, and FOG.
10:35 range so far about 6 points - pretty tough to trade - be patient
10:31 dipping into the Moon T180 timeline
10:25 we may be having another "MM Stinker" day
10:20 getting a hex pattern-see Hex Wheels Today and Hex Wheels tutorial linked on right side of ListOfCharts page
10:17 110 held up, 20 has not crossed below it
10:10 the MTRainbow chart shows the trend up - just pretty slow and choppy
10:04 looks like the hedge fund computers scalped the report. They should be done now.
10:01 aborting for -1
9:53 a bit better - new home sales report at 10:00
9:50 tepid
9:46 stop to 1494
9:42 bought 1496.25 stop 1493.25
9:40 waiting
9:31 outcry session now open - looking weak, so maybe get a dip to buy -need to break 1496.25 to get me excited
9:28 a quick check of volatility is to look at the size of the 3 minute candles - under 4 ticks is bad
9:20 the major problem today is volatility - will we get some or not?
9:15 today's trade times are 09:31 and 13:23 . First one is a possible buy. 20 EXMA sagging above rising 110
9:00 Good Morning. Welcome to the Chaos Clinic. This site has a lot of charts,
so you may find it useful to have several of them available within your
browser. If you have a tabbed browser, you can open separate charts
in separate tabs by right clicking on any link, and selecting "open in new tab"
from the menu. The main list of site pages is at
http://daytradingforecasts.com/chartlistsec.asp
Recommended pages to watch are SPKISS, MTRainbow, and Chat.
For astro stuff, add SPSunMoonMer, Wheel, and Chaos Clinic.
Chaos clinic comments appear at the bottom of the SPKISS, MTRainbow,
and ChaosClinic pages. Comments in the chat room are announced by a
"duck call" noise. This noise also occurs when the sofware detects a
resonant hex pattern on the Wheel page. Trading tutorials
are on the right side of the ListOfCharts page. One should
read Trading the MoonTide Tutorial and Keep it Simple as a minimum.
9:00 Eastern-System: No comments
![]()
![]()