![]()
![]()
********************************************************************************
The January Phenomena And the S&P
Chaos Clinic for 1/28/2022
********************************************************************************
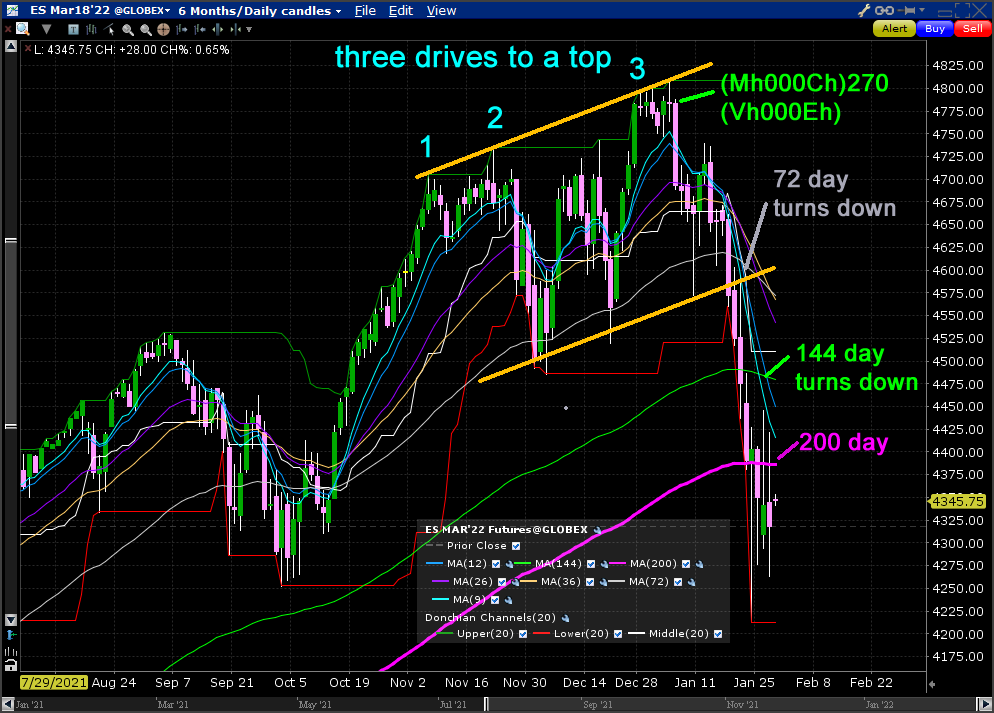
This daily chart shows the serious damage done to the S&P bull market in January.
This chart shows a rainbow of EXMAs, of 9,12,26,36,72,144, and 200 trading days,
It also shows the "Turtle Trader" 20 day Donchian channel,
After a long run up from March 2020, the S&P pulled back during September 2021.
During the pull back, the shorter EXMAs turned down, but the gray 72 day was flat.
The congestion ended in October, as all the EXMAs turned up.
The October rally was sharply up, with 18 green candles out of 19. This lead up to
point 1 of what would be three drives to a top. December saw a change in behavior.
The daily ranges increased sharply, Prices formed a topping channel, basically
bouncing off the up 72 day EXMA, up to point 3 of the 3 drives to a top.
All was well at the end of 2021. But as 2022 opened, there occurred a significant
heliocentric configuration, with Mercury conjoining Chiron, and the pair squaring
Venus and Earth. This last pair conjoined on the 7th, on the S&P natal Node.
This triggered the January slide.
This slide has turned the 72 day and the 144 day EXMAs down. It now looks like the
200 day EXMA is turning down. So January's slide erased the last three month's gains.
The January Phenomena of market folklore says "As January goes, so goes the year."
With the Fed promising to raise interest rates, and the technical evidence so far,
2022 could well be a bear year.
For more on my work and to subscribe to Tomorrow's Market Email Hotline and access to daytradingforecasts.com see
Moneytide.com
Software to plot electric field flux lines in NinjaTrader is available at
energyfieldtrading.com
1/28/2022 1:55:06 PM MT Nel****:: nice short squeeze
1/28/2022 12:52:06 PM MT Robert****:: ESNat72 Yellow to Yellow
1/28/2022 12:48:44 PM MT Robert****:: huge trades up and down today, what a week
1/28/2022 12:30:48 PM MT Robert****:: this is going to 4288
1/28/2022 11:26:16 AM MT Al****:: none
1/28/2022 10:48:16 AM MT Robert****:: before you go, which course teaches about the Moon to Moon trade
1/28/2022 10:46:58 AM MT Al****:: my trade was good for +37, not bad for a Friday, so I'm going to call it a day and not risk the second trade
thanks for coming - see you next week - take some courses
1/28/2022 10:31:36 AM MT Robert****:: yes, sold a few at 4373 to 4364
1/28/2022 10:30:03 AM MT Al****:: sold on down candle and noon - just wanted to get something
The Moon-Noon-Moon pattern has been discussed it the chat room
many time over the years
1/28/2022 10:26:33 AM MT Al****:: sold 4363.75
1/28/2022 10:05:08 AM MT Robert****:: where is the information on the "Moon to Moon"? This is the 2nd time you caught this setup in a week.
1/28/2022 10:02:35 AM MT Al****:: stop now to 4352 - just below the overnight high
1/28/2022 10:00:02 AM MT Al****:: I did not know I would catch a big up day, but yesterday I noticed
the early Moon timeline provided up energy, so when it did today
and I saw the double bottom I was suspicious that the day could run Moon to Moon
1/28/2022 9:57:26 AM MT Robert****:: very helpful to know!
1/28/2022 9:44:12 AM MT Al****:: at this point I like to switch to a 20 minute 2 day 24 hour chart with the same settings per bar as my 3 minute
1/28/2022 9:40:02 AM MT Al****:: correction 4340
1/28/2022 9:39:36 AM MT Al****:: moved my stop to 4350
1/28/2022 9:26:40 AM MT Robert****:: it is very helpful with your Friday breakdowns of what is occuring. I wish everyday was Friday:)
1/28/2022 9:25:10 AM MT Robert****:: 4351 out
1/28/2022 9:20:41 AM MT Al****:: stop now to 4333, just below the early high
1/28/2022 9:19:10 AM MT Al****:: this fast move is aided by the Exchange rotating past Mercury conjoining Pluto
1/28/2022 9:16:14 AM MT Al****:: stop to break even
1/28/2022 9:09:51 AM MT Robert****:: you are correct it is a long now. And inside this trade window I won't short yet with strenth up. The last 30 min close up thru the 20MA was positive for buyers
1/28/2022 9:08:01 AM MT Robert****:: understood, I see the longs trying
1/28/2022 9:00:10 AM MT Al****:: the Chaos clinic chart shows lift from a green swan
1/28/2022 8:55:54 AM MT Al****:: I took a break for breakfast and dog walk
took this 20/110 buy at 4326.75
1/28/2022 8:42:37 AM MT Robert****:: ESNat360 Green Line
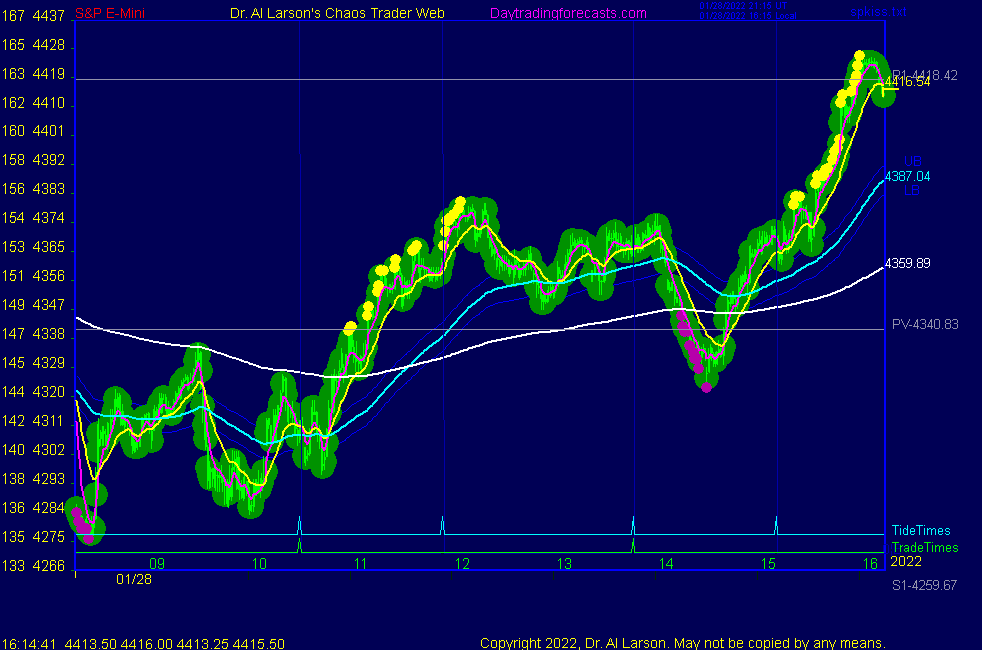
1/28/2022 8:38:52 AM MT Robert****:: SPKiss chart 3 - white acting as Resistance
1/28/2022 7:41:33 AM MT Al****:: normal session open produced a white to white drop on esnat72
1/28/2022 7:40:57 AM MT Robert****:: Do you think we can get down to 4212
1/28/2022 7:18:10 AM MT Al****:: this early low is a double bottom with yesterday's suggesting the market holds up today
1/28/2022 7:13:49 AM MT Al****:: on that esnat72 chart note that the overnight down move has
7 swings
1/28/2022 7:02:51 AM MT Al****:: today's 8:30 economic reports came on the Moon T000 timeline
so they caught some Moon juice creating a yellow to yellow vibration
move on Secret->esnat72
1/28/2022 6:59:26 AM MT Al****:: that too DWY
1/28/2022 6:41:56 AM MT Al****:: Good Morning visitors. Welcome to the Chaos Clinic.
The written Chaos Clinic is on the AUX page.
This site has a lot of charts,
so you may find it useful to have several of them available within your
browser. If you have a tabbed browser, you can open separate charts
in separate tabs by right clicking on any link, and selecting "open in new tab"
from the menu. The main list of site pages is at
http://daytradingforecasts.com/chartlistsec.asp
Recommended pages to watch are SPKISS, MTRainbow, and Chat.
For astro stuff, add SPSunMoon, Wheel, and Chaos Clinic.
A special set of Dr. Al's research charts are on the Secret page.
Comments in the chat room are announced by a
"duck call" noise. This noise also occurs when the software detects a
resonant hex pattern on the Wheel page. MoonTide trading tutorials
are on the right side of the ListOfCharts page. One should
read Trading the MoonTide Tutorial and Keep it Simple as a minimum.
Many subscribers do not strictly trade the MoonTides, but use the charts on this
site as input to their own trading strategies. For example, charts 5 and 6 on the
SPKiss page are a good starting point for swing traders.
Also on this site is the Certified Chaos Trader's Room. That room is open
to graduates of my 4 main courses. See http://moneytide.com -> Courses for details.
1/28/2022 6:38:57 AM MT DWY:: look closer to the chart on the aux page. u will see george lindsey's 3 peaks and a dome pattern.
9:00 Eastern-System: No comments
![]()
![]()