
Chaos Clinic Recap
Here are Al's comments
3:34 thanks for coming; see you next week; take a course or two
3:33 covering for +8; ran into the closing noise
3:28 stop to 1301
3:22 stop to 1300, locking 5
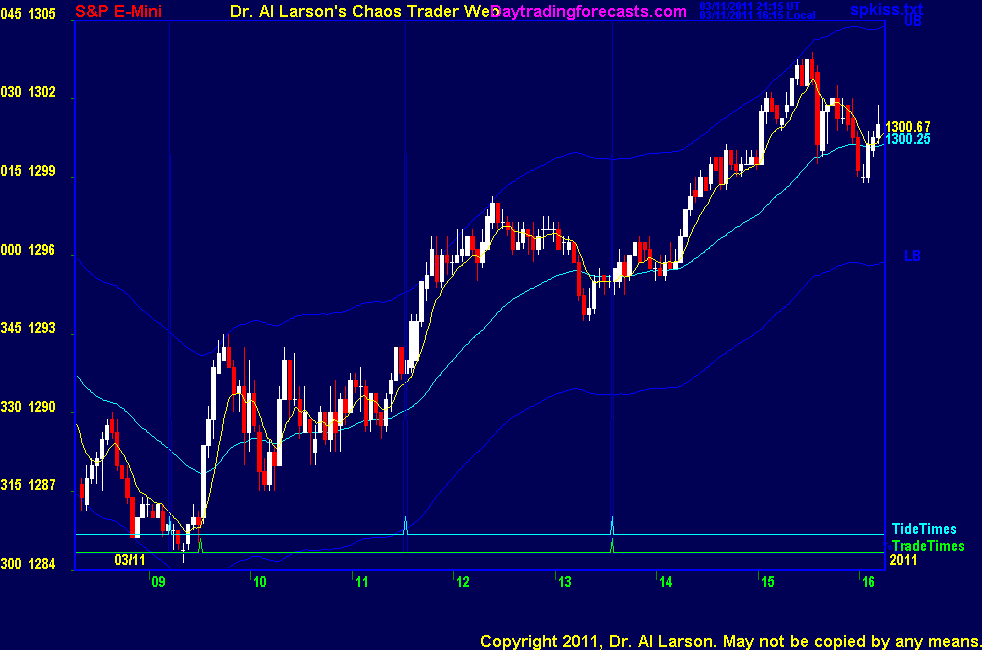
3:17 10:15 is low at 1287 +18 = 1305 harmonic move
3:16 still OK
3:07 looking good; stop to 1299, under last minor low
3:01 stop to 1298
2:54 stop to 1297
2:46 stop to 1296.5
2:40 struggling a bit just under yesterday's midday high
2:33 stop to 1296, just under the 110 EXMA
2:23 my 9 point cover is 1304 if we get there
2:21 stop now to 1295
2:16 now getting some juice
2:00 still not a lot of juice. Should get more as the day wears on.
1:49 stop to 1293; trade looks OK
1:34 bought 1295 stop 1292; like the bounce off the 440 on move 4
1:31 looks like a move 4 of 7 in up CC
1:24 bit of a sell off. On my 3 day chart, this is all part of a congestion pattern starting early yesterday; doing nothing
1:14 on the SPSunMoonMer chart see that prices got to the Mercury +M000 flux and faded. It set late high yesterday
1:10 I'm back. see prices pretty flat for last hour or so.
12:10 I'm going to take a break now. I'll be back before the next trade time
11:54 posted my FOP chart to the CCT Room
11:45 now I'm fitting an up FOP to this action. Not chasing this trade because it is not one of the planned trades
Unfortunately, my trade selection software did not select the 11:32 Tide time as a trade-that happens
11:40 now the MTRAinbow chart is more positive. Hopefully next trade time at 13:34 wiil give a decent trade setup
11:37 one has to be careful near the end of congestions; My FOG pattern told me where that end was. When I saw the action, I aborted
11:28 I aborted because prices moved out of my down FOP
11:24 I uncled and aborted for -3
11:11 my automatic hex pattern recognizer has detected a hex pattern with corners a 1290 =/- multiples of 12 points
Hex paterns tend to be stable points for a while, then move to the next corner. See more on Hex Wheels page, linked right side of ListOfCharts
11:06 the trade is stuck in a congestion. My analysis says the congestion ends in next 30-40 minutes; so I wait
10:55 the MTRainbow chart is still congesting; 440 is down, 110 is flat
10:48 patterns also give me a tool for staying patient, since I can look ahead hours and not get caught up in swings of minutes
10:44 EXMA's in a Rainbow help me judge the nature of the market more than give me exact timing. My emylar overlays
are my real edge. They are two dimentional patterns, much superior to one dimensional indicators
10:37 stop to 1293, just above the 440 EXMA and as suggested by my FOG pattern
10:33 my FOG still looks good; will post an updated chart to the CCT Room
10:27 my FOP still looks good; my wide stop is due to the nature of the market and reflects the risk I must accept to trade here
10:21 here I've held my stop above the 440 EXMA
10:17 very choppy
10:12 still treading water-needs to move soon
10:02 now the MTRAinbow chart shows congestion; FOP shows possible drop; pressing a bit-sold 1288 stop 1294
9:58 the high frequency trading firms make trades lasting just seconds; that generates this sort of chop.
9:55 sentiment worst than expected, rally turned just as suggested by my Fractal of Pi. May give a sell on the 20/110 in a "hook and go" pattern
9:51 rally fading as come into the news time; lots of competing computers trying to get an edge. Just watching
9:49 updated my charts in the CCT Room. Now a FOP and a FOG. They may not have been posted correctly earlier.
9:42 the 20 EXMA has crossed the 110, but the move is too late to buy for a good entry. Often happens early in the day. Be patient. Rally resistance at the 440 EXMA
9:41 on a two day chart this looks like a move 6 of 7 in a down chaos clamshell.
9:33 outcry session open- on the MTRainbow chart, the 440 EXMA is down, prices just got above the 110, and the 20 is up
looks bullish, so watching to see how they move over then next 30-40 minutes
9:29 I have placed two Face of God charts in the Certified Chaos Trader's Room. That room is open
to graduates of my 4 main courses. See http://moneytide.com -> Courses for details.
9:22 we have Consumer sentiment report at 9:55. This is one of the reports that high frequency trading firms target.
That adds some volatility for about 15 minutes. So I'm just watching until that is over.
9:15 weak pre-outcry; looks like a "sag but hold up" day. Trade times are 09:31 and 13:34
The first trade time may not set up a good trade because the market is already in an extended down trend
9:00 Good morning from Chaos Manor
Besides the comments made by Al, the chat room is has live
comments from other traders who sometimes share their views,
trades and tips. Below are the chat room comments from this clinic
3/11/2011 2:08:51 PM MT bhskr:: @Al - ok thanks
3/11/2011 1:38:10 PM MT Al****:: 18 is 1/4 th wheel of 72
3/11/2011 1:35:52 PM MT bhskr:: @Al at 10:15 you have the comment low 1287 + 18 = 1305 harmonic move - How do you get the 18 - is it part of one of the later courses? (I have only taken CIOC and FOP)
3/11/2011 1:31:27 PM MT TG****:: MM, for what it's worth, I found this site that provides O-H-L-C pit pricing when you setup the chart correctly with SPM11 for the ticker. Try copying and pasting into browser and saving the chart into favorites.
http://www2.barchart.com/chart.php?sym=SPM11&style=technical&p=DO&d=L&size=M&log=0&ed=03%2F11%2F2011&v=2&g=1&late=1&evnt=1&o1=&o2=&o3=&ch1=011&ch1a=&ch1b=&ch1c=&ov1=&ov1a=&ov1b=&ov1c=&ch2=&ch2a=&ch2b=&ch2c=&ov2=&ov2a=&ov2b=&ov2c=&submitted=1&fpage=&txtDate=03%2F11%2F2011
3/11/2011 1:21:24 PM MT Al****:: MM: no, these are being reported for the big S&P. Several sources I have checked have quit reporting the outcry session and just report the electronic session.
3/11/2011 1:05:48 PM MT mm****:: Al - my understading is that the pit's S/R levels are based on the "big" S&P/outcry session, which would not be 24 hrs - your vendor may have switched to the e mini.
3/11/2011 12:46:58 PM MT TG****:: Thank you MM, and Al. I had these on my old computer but hard drive crashed. Couldn't locate that particular file in my backed up files.
3/11/2011 12:32:05 PM MT mm****:: TJ - P+2(P-L)=R3 R3-2(H-L)=S3
3/11/2011 12:04:32 PM MT TG****:: MM, for two of the levels I can't seem to figure out what the formula or calculation is to get there. Not sure what the calculation is to get to the Support level 76.75 and the Resistance level 02.25
3/11/2011 11:16:39 AM MT mm****:: TG - also: I did see your question yesterday too late to respond, so: I answered this question once before, obviously before you joined the room: I use the candlesticks purely for the SS, H, dojis, etc. Combinations/patterens of sticks are useless in day-trading - IMHO.
3/11/2011 11:11:14 AM MT mm****:: Here we go: H:o.50-L:87.75-C:89.50-P:92.50 - and: 71.75-76.75-79.75-84.75-97.50-2.25-5.25-10.25
3/11/2011 10:26:58 AM MT Al****:: TG, see
http://www.mypivots.com/articles/articles.aspx?artnum=36
3/11/2011 10:21:59 AM MT TG****:: MM, could you do me a huge favor and post the formulas for the pit pivot, support and resistance levels.
3/11/2011 7:14:00 AM MT Al****:: GM all. Good luck today.
MM: it may be that my vendor is getting 24 hour quotes from the exchange now. I'll have to look into it
3/11/2011 5:19:06 AM MT mm****:: Al - I am afraid that one number of your vendor is still wrong - which of course invalidates all the calculations: according to the WSJ the H was 1300.50, not 1315.75 - I'll do it "by hand" again
3/11/2011 5:05:54 AM MT mm****:: gm all - 40F and raining - have a great day
9:00 Eastern-System: No comments


[ Live Clinics on Friday on DaytradingForecasts.com ]