********************************************************************************
TSLA's Energy Forecast
Chaos Clinic for 4/1/2022
********************************************************************************
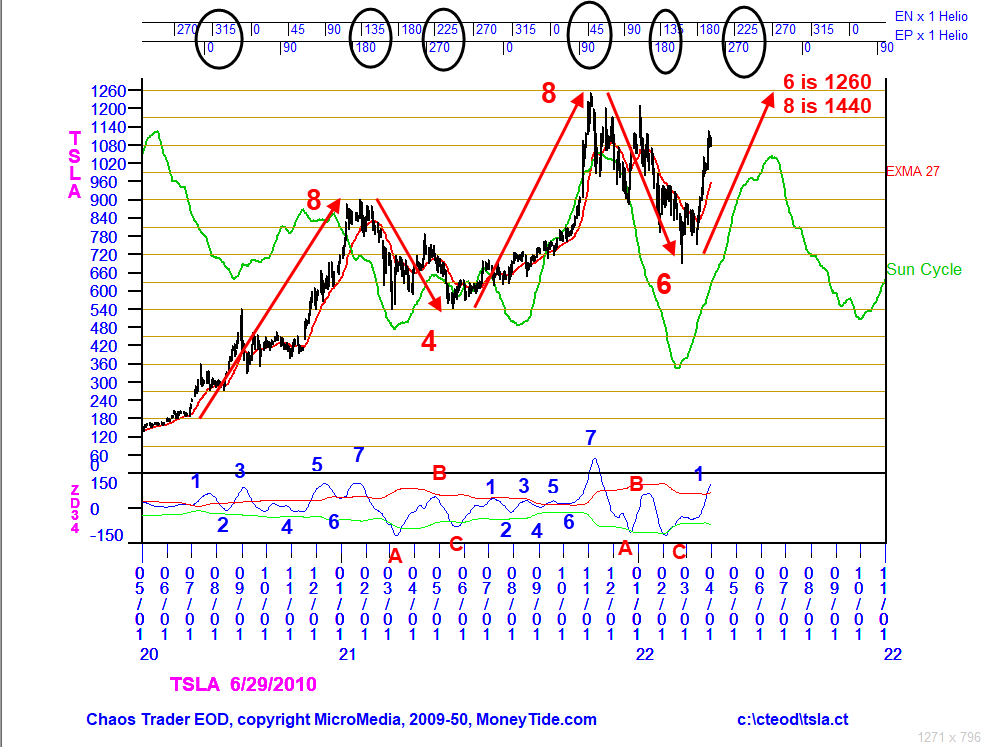
This is a daily chart of Tesla stock, TSLA, over the past two years.
There are several unique features of this chart.
First is the green line, labeled Sun Cycle. This is an energy forecast for TSLA,
made with my WinXGO software. The only input for this forecast is the first trade
date of TSLA. The XGO data is smoothed with a ZD filter, whose length is set to bring
out the energy due to the sun. While not a perfect fit, this forecast has been
very helpful in anticipating the swings in TSLA.
The bottom panel shows a 34 day Zero Delay oscillator with volatility bands. It show
that the rallies have tended to form 7 move up Chaos Clamshells, linked by 3 move ABC
patterns. The upturns at C have proven to be good buy signals.
The background of the chart has horizontal lines, which are natural vibration levels
for TSLA based on its first trade chart. Starting at the 180 level in mid 2020,
the first rally went up 8 levels, or 720 points. The pullback into mid 2021 was 4
vibration levels. The next rally into late 2021 was another 8 levels. The pullback
into early 2022 was 6 levels, to the 720 ( two circles ) level. The rally in progress
can be anticipated to go up 6 or 8 levels. Note that all of these moves are integer
ratios.
Along the top of the chart are two astro cycles that run in TSLA, EP,Earth-Pluto,
and EN, Earth-Neptune. When aspects of the cycles coincide, tops and bottoms tend
to occur. Several of the point are circled.
For more on my work and to subscribe to Tomorrow's Market Email Hotline and access to daytradingforecasts.com see
Moneytide.com
Software to plot electric field flux lines in NinjaTrader is available at
energyfieldtrading.com

4/1/2022 1:21:52 PM MT raf:: Thank you Al for todays talk - I like the SPBais as it filters out the noise (RED/WHITE) bars, like the MTRainbow. Have a great weekend, hope the weather is getting better in your area.
4/1/2022 12:37:57 PM MT Al****:: note also the green swan on the Chaos Clinic chart
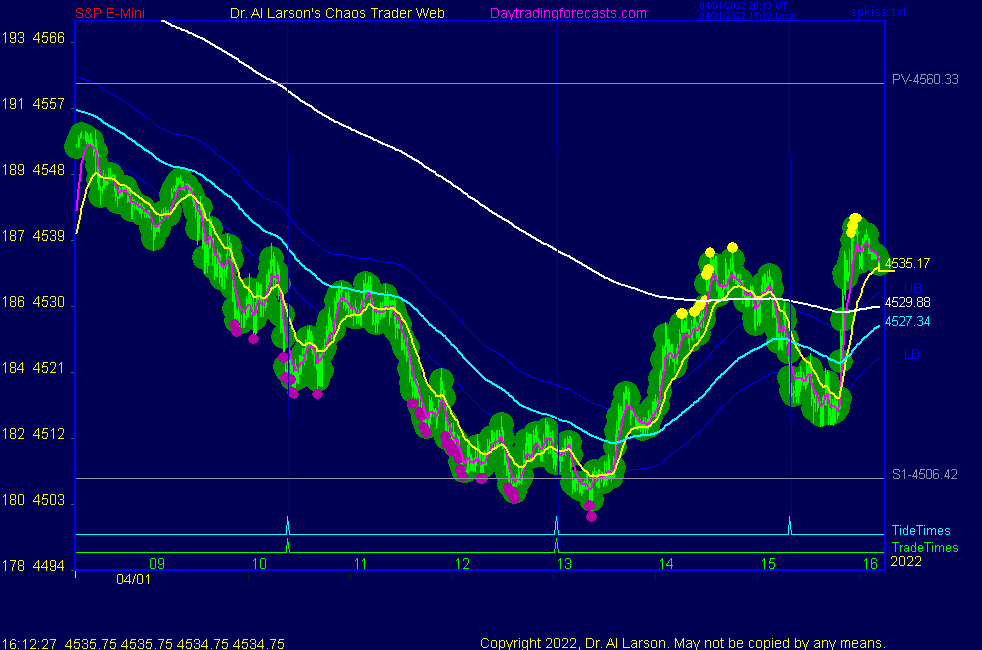
4/1/2022 12:30:00 PM MT Al****:: this is a good example of the Moon's influence on the S&P. Today is a New Moon. Prices turned up exactly when the Exchange was rotated past the Moon
4/1/2022 11:45:48 AM MT Al****:: got a little bounce from Moon - I think I'm going to call it a day
thanks for coming -take some courses - see you next week
4/1/2022 11:22:03 AM MT Al****:: on the SPSunMoon chart you can see the Exchange is rotating past the Moon, shown by the T000 timeline
4/1/2022 11:16:12 AM MT Al****:: from this week's high this is a move 5. Move 5s in a Chaos Clamshell are often the largest. So a drop as far as S4 4418 is possible
4/1/2022 11:11:04 AM MT Al****:: modest support at S1, looks to be ending as Exchange rotates past Sun, solar noon
4/1/2022 10:06:32 AM MT Al****:: note the bar colors on the Chaos Clinic chart - caught that inversion
4/1/2022 9:57:42 AM MT Al****:: Chart 3 on SPKISS showing steady down
4/1/2022 9:43:26 AM MT Al****:: looks like inverted to green Tide
4/1/2022 8:57:19 AM MT Al****:: from the 8:30 high to the 10:39 low my 3 minute candle chart shows 7 moves
4/1/2022 8:50:09 AM MT Al****:: the Chaos Clinic chart shows bottoming action on the red -Tide
4/1/2022 8:36:30 AM MT Al****:: chart 1 on the SPKISS page shows the first trade was on the red -Tide
4/1/2022 8:36:09 AM MT pab:: Putin to Cut Gas Supply to Europe Today Unless Paid in Rubles
4/1/2022 7:14:24 AM MT pab:: New record in inflation in Europe
4/1/2022 7:00:08 AM MT Al****:: the employment report was lower than expected
4/1/2022 6:42:38 AM MT Al****:: Good Morning visitors. Welcome to the Chaos Clinic.
The written Chaos Clinic is on the AUX page.
This site has a lot of charts,
so you may find it useful to have several of them available within your
browser. If you have a tabbed browser, you can open separate charts
in separate tabs by right clicking on any link, and selecting "open in new tab"
from the menu. The main list of site pages is at
http://daytradingforecasts.com/chartlistsec.asp
Recommended pages to watch are SPKISS, MTRainbow, and Chat.
For astro stuff, add SPSunMoon, Wheel, and Chaos Clinic.
A special set of Dr. Al's research charts are on the Secret page.
Comments in the chat room are announced by a
"duck call" noise. This noise also occurs when the software detects a
resonant hex pattern on the Wheel page. MoonTide trading tutorials
are on the right side of the ListOfCharts page. One should
read Trading the MoonTide Tutorial and Keep it Simple as a minimum.
Many subscribers do not strictly trade the MoonTides, but use the charts on this
site as input to their own trading strategies. For example, charts 5 and 6 on the
SPKiss page are a good starting point for swing traders.
Also on this site is the Certified Chaos Trader's Room. That room is open
to graduates of my 4 main courses. See http://moneytide.com -> Courses for details.
9:00 Eastern-System: No comments