![]()
![]()
********************************************************************************
Andrew Pitchfork In The S&P
Chaos Clinic for 4/8/2022
********************************************************************************
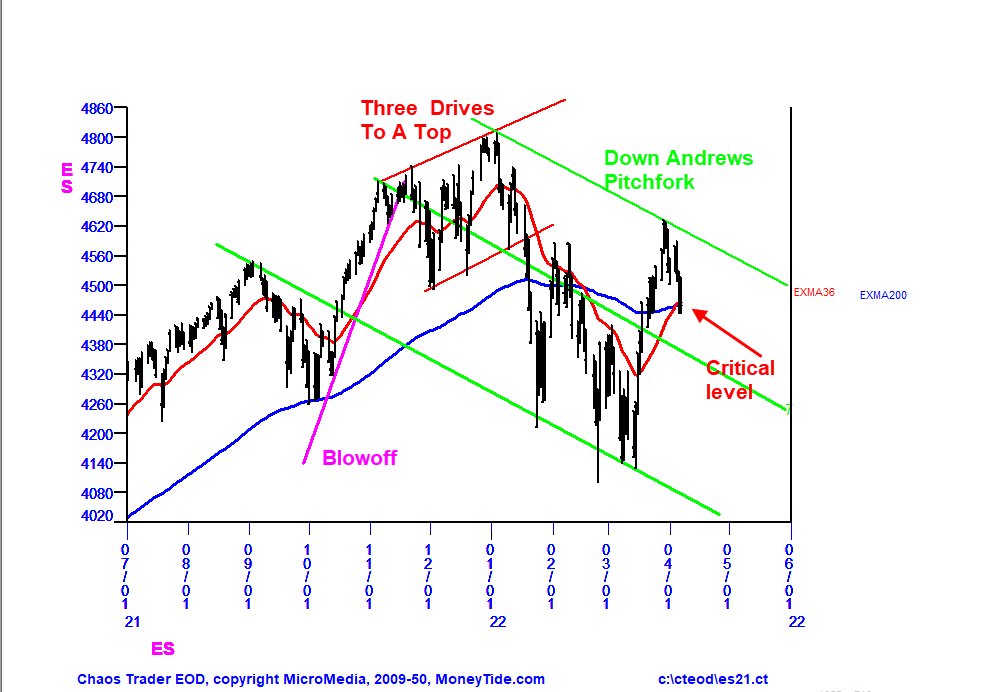
This chart shows a possible Andrews Pitchfork formation in the daily S&P
futures. The chart shows two EXMAs, a red 36 day and a blue 200 day. These help track
the trend.
The S&P moved up steadily in 2021, staying above the 200 EXMA, until a dip
in September. This was followed by a fast blow off rally in October. During
November and December, trade stayed in an up channel (red), making three
drives to a top.
Then in January, prices dropped sharply, turning the 36 day EXMA down. Prices made lower lows
in January, February, and March. Then starting mid March, they rallied sharply for two weeks.
Since then prices have dropped back down to the 200 day EXMA, which is slightly down. The
36day EXMA has turned up to the same level. This is a critical level.
There is a possible down Andrews pitchfork, shown by the three green lines. A break below the
lows of this week would turn the EXMAs down. This could mean a follow through on the pitchfork
pattern and a serious decline in April. The two most common months for US stock market
crashes are October and April, with the period between the 5th and 20th being weakest.
This may not happen, but be alert.
For more on my work and to subscribe to Tomorrow's Market Email Hotline and access to daytradingforecasts.com see
Moneytide.com
Software to plot electric field flux lines in NinjaTrader is available at
energyfieldtrading.com
4/8/2022 12:51:34 PM MT Al****:: calling it a day -thanks for coming-see you in 2 weeks-take some courses
4/8/2022 12:26:49 PM MT Al****:: no-sicking with red -Tide
4/8/2022 12:21:30 PM MT Al****:: holding up late - may rally as per green +Tide
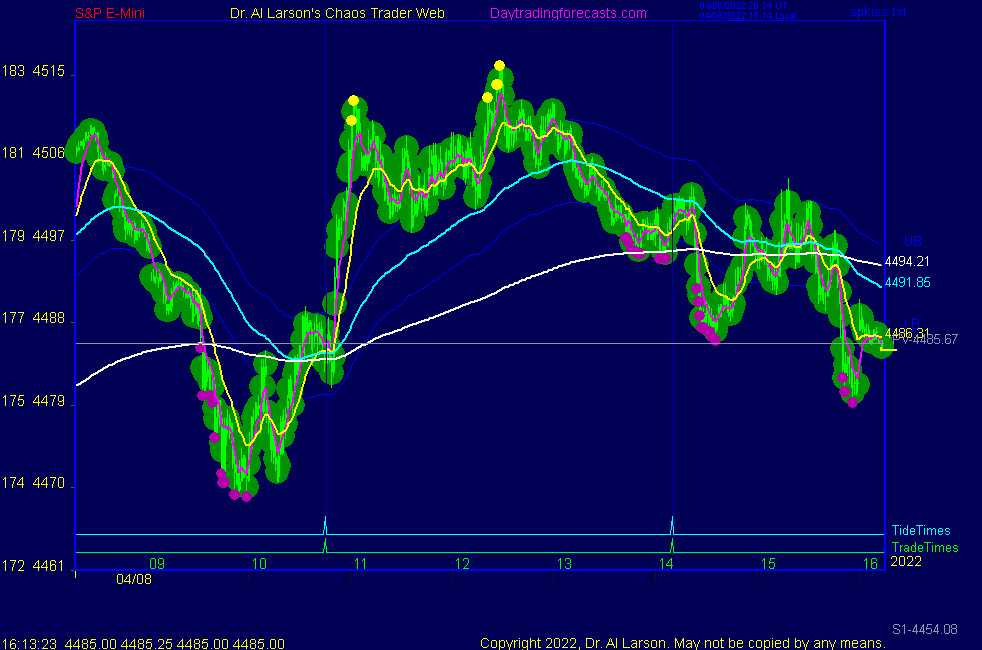
4/8/2022 11:11:06 AM MT Al****:: today flash boys bought pivot 4485 on the early dip, may make it up to R1 4527
4/8/2022 10:54:33 AM MT Robert****:: 4363 next week target - 150 down
4/8/2022 10:30:22 AM MT Al****:: added some Moon juice
4/8/2022 10:10:58 AM MT Al****:: Pluto and Venus were active on the 10th harmonic, 144 minute apart
the Moon T270 timeline coming up is 144 minutes past Venus, so is something to watch
4/8/2022 9:44:40 AM MT Al****:: note on the Secret->esnat360 chart that the yellow vibration was
support on 4/1 4/5 and early on 4/6 , then it failed and is now resistance
4/8/2022 9:39:40 AM MT Al****:: Secret->esnat72 shows you the 24 hour daily candle with the open
on the left edge of the chart on the magenta vibration
so far today is a daily doji
4/8/2022 9:15:27 AM MT Al****:: this is chaos at its finest, caused in part by the rotating earth
the high near 7:30 is where the NYSE rotated past Pluto
the low near 10:00 is where the NYSE rotated past Venus
the rally was along a green swan line as per the Chaos Clinic chart
on that chart note the bar colors
4/8/2022 8:14:40 AM MT Al****:: note also that the move was forecast by the red -Tide on the SPKISS page chart 1
4/8/2022 8:12:12 AM MT Al****:: note on the Secret->esnat72 chart the move from white to white vibration levels
4/8/2022 6:32:39 AM MT Al****:: Good Morning visitors. Welcome to the Chaos Clinic.
The written Chaos Clinic is on the AUX page.
This site has a lot of charts,
so you may find it useful to have several of them available within your
browser. If you have a tabbed browser, you can open separate charts
in separate tabs by right clicking on any link, and selecting "open in new tab"
from the menu. The main list of site pages is at
http://daytradingforecasts.com/chartlistsec.asp
Recommended pages to watch are SPKISS, MTRainbow, and Chat.
For astro stuff, add SPSunMoon, Wheel, and Chaos Clinic.
A special set of Dr. Al's research charts are on the Secret page.
Comments in the chat room are announced by a
"duck call" noise. This noise also occurs when the software detects a
resonant hex pattern on the Wheel page. MoonTide trading tutorials
are on the right side of the ListOfCharts page. One should
read Trading the MoonTide Tutorial and Keep it Simple as a minimum.
Many subscribers do not strictly trade the MoonTides, but use the charts on this
site as input to their own trading strategies. For example, charts 5 and 6 on the
SPKiss page are a good starting point for swing traders.
Also on this site is the Certified Chaos Trader's Room. That room is open
to graduates of my 4 main courses. See http://moneytide.com -> Courses for details.
9:00 Eastern-System: No comments
![]()
![]()