![]()
![]()
********************************************************************************
Growth and Collapse in CME
Chaos Clinic for 5/29/2020
********************************************************************************
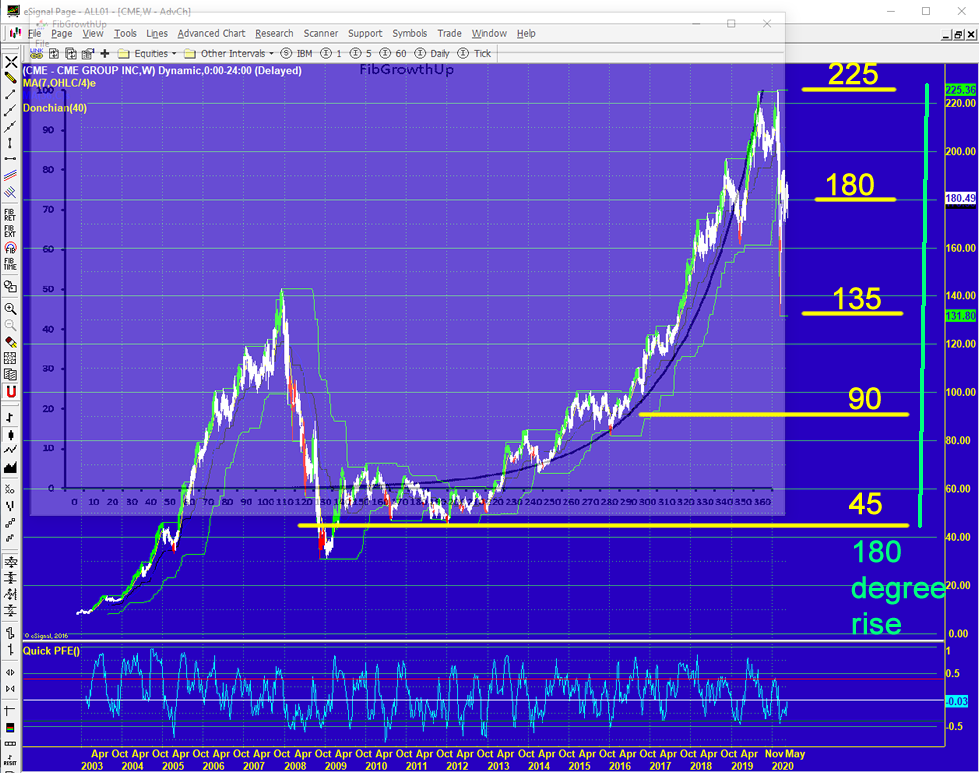
This chart shows the CME stock, essentially the CME derivatives exchange,
over the past 18 years.
Overlaid on the chart is a mathematical power curve I discovered in my research into
how markets work. It is based on the square root of a Fibonacci series. It also
has a 360 degree cycle scale,which helps determine natural cycles behind the growth.
Markets are moved by energy, and energy adds together based on mathematics.
This curve is essentially flat until the 180 degree point, then if rises faster,
and faster, and faster. Then it collapses. My best estimate of the cycle involved
in this example is about 18 years, close to the cycle of the Moon's node.
Another principle of energy addition is that energy adds harmonically, in circles
of 360 degrees. This is clear in CME, where the rally moved
up 180 degrees, from 45 to 225 degrees.
The harmonics are also apparent post peak. The first down move was 90 degrees,
from 225 to 135. The bounce since then was 45 degrees to 180.
Longer term, these power curves often have a matching declining curve, of about
the same duration as the half cycle up in what is a "time domain resonance."
That suggests the down move could take about 9.3 years.
For more on my work, see Moneytide.com
5/29/2020 1:48:46 PM MT qq:: Thank jbs
5/29/2020 1:48:08 PM MT jbs****:: TG, the first trade time was 10:58. I consider the trade window to be 45 minutes before and after. So, the window opened about 10:15. I took the short trade about 10 minutes before the window opened. Of course, success of the trading plan I presented depends on when you enter the trade. If you entered right at the beginning of the trade window, the 10/10 and 15/10 methods would have been profitable, but the 20/10 method would have lost 10 points.
5/29/2020 1:39:51 PM MT jbs****:: qq, that's great!!
5/29/2020 1:37:25 PM MT qq:: Sold at the stall for 2X profit
5/29/2020 1:35:55 PM MT TG****:: today were you using 10:58 as the first trade window.
5/29/2020 1:31:36 PM MT jbs****:: However, for the method to be successful going forward profit and stop levels would need to be adjust for changes in overall market volatility.
But, its has worked very well over the last 42 trading days. Note the results are hypothetical since I didn't trade it live.
If a dull trading day is expected one should not trade this method.
5/29/2020 1:25:45 PM MT jbs****:: TG, thanks for reading my post. Today I would have sold at 10:06 @ 3020. There was a 78.6% probability of reaching 3010, 71.4% of reaching 3005 and 66.7% of reaching 3000. the low at 12:57 was 2992.25.
So each method would have won today.
5/29/2020 1:15:21 PM MT TG****:: JBS, would today have been a pass
5/29/2020 1:06:00 PM MT qq:: Braved buying near the bottom and holding
5/29/2020 1:01:16 PM MT bew:: I look at it now and it is up 40 pts in 9 minutes. What planet or star is making this move?
5/29/2020 1:00:17 PM MT bew:: wow I thought the move at 12:54 was wild but these past 12 mins are crazy
5/29/2020 12:56:52 PM MT jbs****:: Not sure anyone is reading what I type, but I thought I would update you on some research I'm doing in Tradestation. It is based on entering trades as indicated by the EMAs within the first trade window each day. On entry a 10 point stop loss and 10 point profit stop are entered. I have tracked trades now for 42 days. 78.6% of the trades have been winning trades. The win/loss ratio is 1.02, meaning the average trade profit for winning trades was 1.02 times the average trade loss for losing trades. 1 ES contract would have gained $14,125 (pre-com). These hypothetical results are very good.
When I change the settings to 20 profit target and 10 point stop loss the hypothetically results are acceptable at 66.7% wins and 1.76 Win/Loss ratio. 1 ES contract would have gained $20,725 (pre-com).
If settings were 15 profit target stop and 10 stop loss, win% would be 71.4% & W/L ratio would be 1.53. And profit before commission would be $19,137 for 1 ES contract. Very nice.
The key to this methods continued success is market volatility. Low volatility mean losing trades.
Any way, the month of May has been a losing month for me, net -160. So in June I will be start trading one of the methods mentioned above, likely the 15/10 model.
Don't know that anyone actually reads my posts, but its a nice space to post and keep myself accountable for my trading.
Have a great weekend!
5/29/2020 12:41:39 PM MT TG****:: Fed chair speech and then POTUS, it's like big rocks being thrown into a pond.
5/29/2020 12:30:32 PM MT jbs****:: Okay, got to play by the rules. Price hit my stop. Loss back my big gain from yesterday plus some. Hard to imagine losing on such a nice trending day. Net -16 points today.
5/29/2020 12:22:32 PM MT jbs****:: Moved my stop to 25. 20/100 cross indicates its time to abort my short trade. I placed my stop at 25. Hopefully what goes up does come back down soon.
5/29/2020 12:13:08 PM MT jbs****:: Wow, the 20 is about to cross above the 110 again. That will signal me to cover on my short trade from earlier today. I nice point gain might become a 15 point loss. The next couple bars will let me know.
5/29/2020 12:05:21 PM MT jbs****:: Looks like another Daniel chart vertical line is hitting about now.
5/29/2020 11:25:55 AM MT jbs****:: I think we'll see some price movement around 1:30, likely to the down side.
5/29/2020 11:15:54 AM MT jbs****:: In danger again of having to abort my short trade. 20 looks to be crossing above the 110. Sure wish I had left my target profit stop at the S2. Oh well, the trend may continue down. Sure don't want to lose what I gained this morning plus some. We shall see.
5/29/2020 11:12:32 AM MT jbs****:: Trump is said he would to be weighing sanctions on China finance sector over Hong Kong. Maybe that did it. Otherwise, the spike was right at the time of the vertical line on the Daniel chart. Another vertical coming at 2pm.
5/29/2020 11:03:10 AM MT TG****:: anyone know what that dip and then sharp up move was
5/29/2020 10:33:32 AM MT jbs****:: Appears to be staying on the red tide for now.
5/29/2020 10:01:23 AM MT jbs****:: I'm thinking price might bounce of the S1 pivot resistance and go down to the S2 pivot. We shall see.
5/29/2020 9:59:03 AM MT jbs****:: Price seems to be following the red tide which is about to turn down. And there's another Daniel vertical line about 12:30. So I think I'm going to stay in my short trade for now.
5/29/2020 9:55:28 AM MT jbs****:: At this point its a matter of sticking with the trend and the 440 stop loss or covering if 20 cross above the 110.
5/29/2020 9:54:06 AM MT jbs****:: I didn't follow my own advice and wait for the tide turn to reenter short. I am short from 3003.25. Al would tell me that a real warning sign of reversal would be the bounce up off the donchian (53 setting) and the a 20 cross above 110 which appears a possibility at this point. I had my stop loss placed above the 110, but moved it up above the 440 since price trend down has been so strong.
5/29/2020 9:36:09 AM MT qq:: Stopped out
5/29/2020 9:22:56 AM MT qq:: If no sharp up then it's over for bulls
5/29/2020 9:16:11 AM MT qq:: Bought some SPY calls minutes ago
5/29/2020 9:05:29 AM MT qq:: Stopped out at small loss
5/29/2020 9:01:02 AM MT jbs****:: Covered my short position. +5.5 I want to see if the tide turn reverses price.
5/29/2020 8:59:13 AM MT qq:: Bought QQQ since moving up to SPY. It appears to have bottomed and it's moving up.
5/29/2020 8:16:55 AM MT jbs****:: Hitting a green swan line on Chaos chart about now. That might tell us something about potential for reversal.
5/29/2020 8:10:56 AM MT qq:: jbs That 11:15 vert line might be time for entering. I'm thinking long.
5/29/2020 8:08:45 AM MT Al****:: leaving now to celebrate my wife's birthday-good luck
5/29/2020 8:08:27 AM MT jbs****:: I see a vertical lines on the Daniel chart around 11:15,12:30 and 14:00.
5/29/2020 8:00:55 AM MT qq:: Nasdaq moving up
5/29/2020 7:59:03 AM MT qq:: EXMAs seem to be turning up, but it might test lows or near before going up
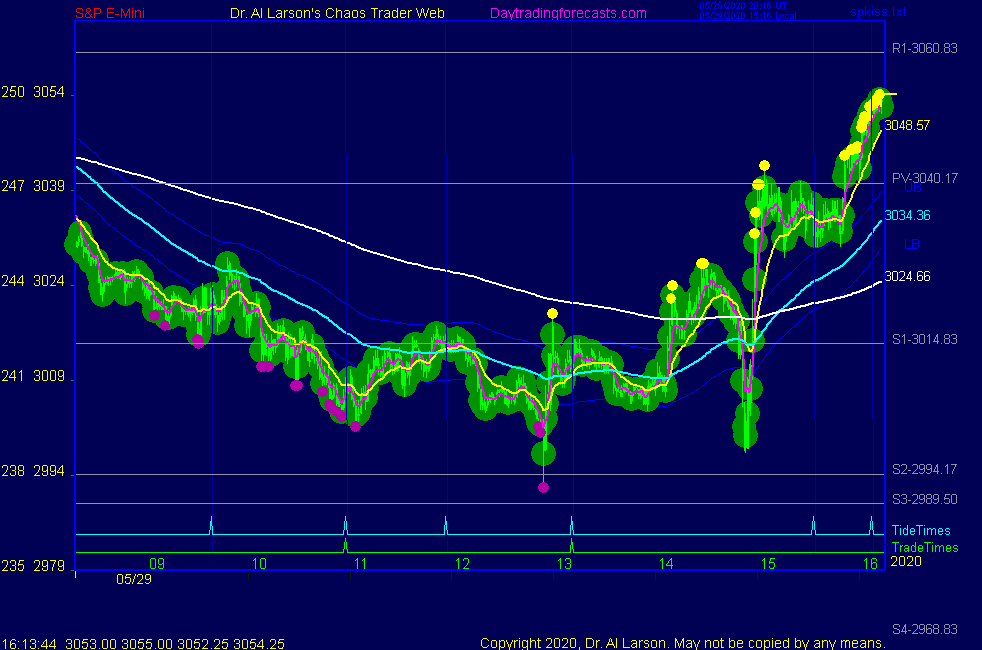
5/29/2020 7:40:59 AM MT Al****:: 3rd and last chart on SPKiss page suggest we may have a longer term change in trend
5/29/2020 7:34:26 AM MT Al****:: jbs, I entered late after I was sure the EXMAs were up
5/29/2020 7:33:29 AM MT qq:: Big drop in $TRIN from about 2 to 0.6
5/29/2020 7:27:51 AM MT qq:: 2nd SPKISS chart green tide seems to be following
5/29/2020 7:21:42 AM MT jbs****:: Al, I'm looking back at yesterday's trades for the purpose of learning. You bought at 3048 in the first trade window. Did you enter near the beginning or at the end of the first trade window? If you entered in the first part of the window ie around 9:15, did you come close to aborting the trade as price moved sharply down even though the 20 didn't cross below the 110? If you bought in the last part of the window, what was the logic for not entering earlier in the window? Thanks for supporting my effort to learn!!!
5/29/2020 6:45:25 AM MT jbs****:: Good morning
5/29/2020 6:18:44 AM MT Al****:: GM all-good luck today
Chaos Clinic is posted on AUX page
9:00 Eastern-System: No comments
![]()
![]()