
Chaos Clinic Recap
Here are Al's comments
********************************************************************************
젨젨젨Cashing in on Brexit
젨젨젨Chaos Clinic for June 28, 2019
********************************************************************************
Since the June 23,2016 UK vote to leave the European Union, traders have wondered
how they might profit from the event. In my 3/1/2019 Chaos Clinic, I asked
"Is the Euro Ready To Rally?" I showed a possible cycle time for an upturn,
but warned that this upturn needed to be confirmed by the tracking exponential moving
averages. That is now happening.
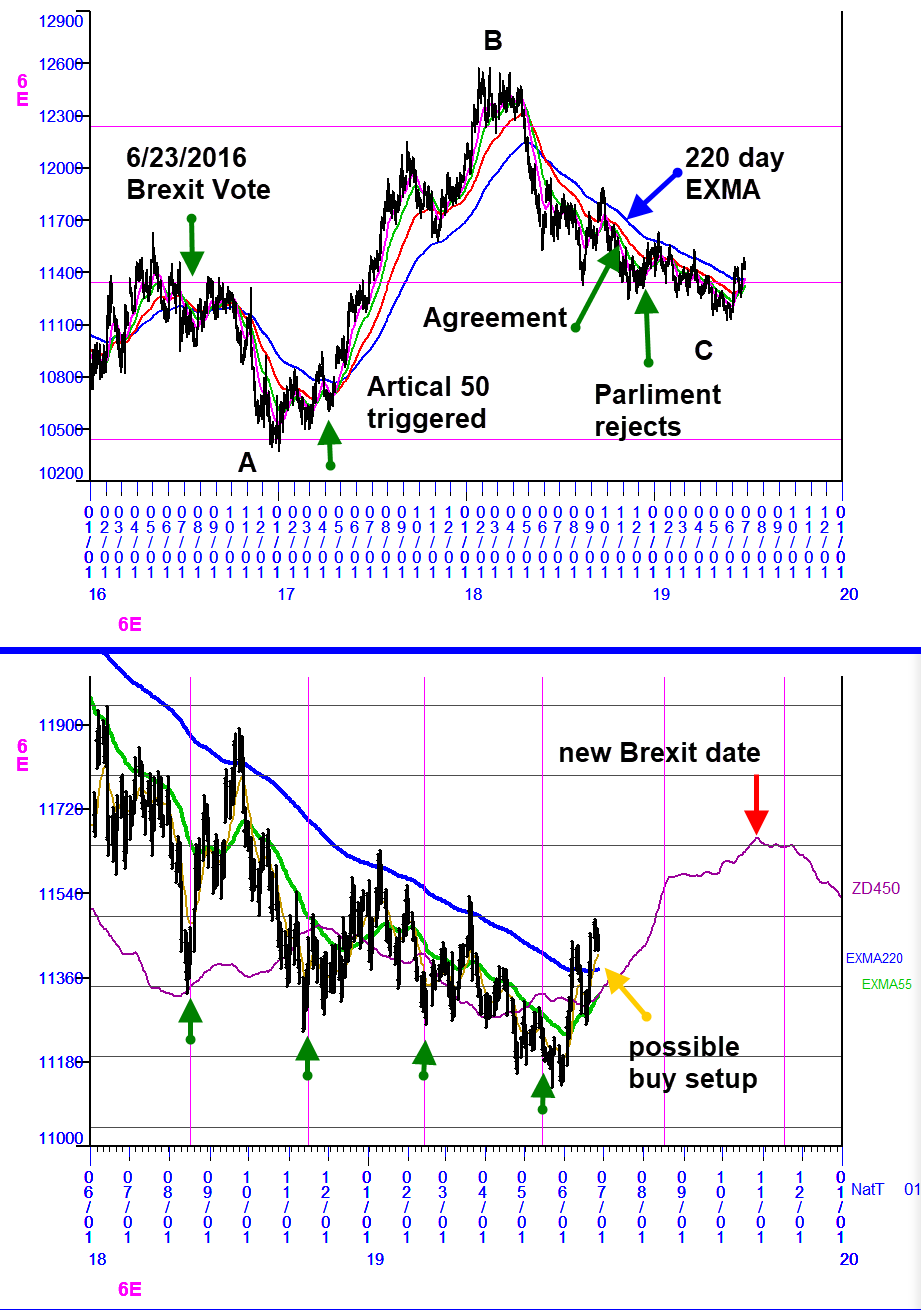
The top chart shows the Euro futures over the past several years. While probably
not cause and effect, the Euro declined after the Brexit vote, then rallied after
the Article 50 was triggered, starting the formal negotiations for the terms of how
Britain would exit the EU. The original deadline for Britain was two years after
the Article 50 was triggered, or March 29, 2019. Britain and the EU reached an
an agreement in time, but the British parliament rejected the deal. Last minute
negotiations to prevent the UK from "crashing out" of the EU with no deal extended
the deadline to October 31, 2019.
Reviewing this chart from a technical analysis stand point, the Euro has made an
ABC pattern. The legs of this pattern have been well tracked by a rainbow of
EXMAs, the longest of which is 220 calendar days. Also shown are three horizontal
vibration levels for the cycle I used in my 3/1/2019 analysis. Since the Brexit
vote, the Euro dropped one level, rallied two, and dropped one, returning to the
original vibration level. In terms of vibration levels, this is a rally with a
50% pullback, a common point for traders to look for a trade setup.
The second chart shows a closer view of this setup. The down sloping blue line
is the 220 EXMA. Prices have now broken above it twice, turning it up. The green
up arrows mark minor cycle lows. The low in May shifted right, suggesting longer
cycles at work. A 27 day EXMA has crossed above the 220,but the 55 day has not
yet done so.
To evaluate the potential of a tr4ade here, I overlayed a ZD450 energy forecast
made with my WinXGO software. This forecast is made using only the first trade
date. No price data is used in the forecast. So the scaling of forecast to price
is arbitrary, but the forecast gives good guidance and direction. Surprisingly,
this forecast suggests a Euro rally until about the time of the new Brexit date.
This trade setup is not complete. I would like to see prices dip back to the 220
day EXMA, and for the EXMA rainbow to progressively have more shorter EXMAs cross
the 220. Traders should proceed at their own risk. Trades can be made
in the FX market, the futures market, or in EURO Exchange Traded Funds.
For WinXGO software and tools to study astro cycles, look for
WinGephi-The Trader's Ephemeris
at Moneytide.com
or the NinjaTrader astro software at EnergyFieldTrading.com
Besides the comments made by Al, the chat room has live
comments from other traders who sometimes share their views,
trades and tips. Below are the chat room comments from this clinic
6/28/2019 2:05:00 PM MT EAS:: Thanks Al and everyone.
6/28/2019 2:02:24 PM MT Al****:: stopped me out for small gain. Done for the day/week. Have a good weekend. Take some courses.
6/28/2019 2:01:09 PM MT clb****:: That's amazing. I wondered for a moment if we made a deal with China. Crazy volatility today.
6/28/2019 1:59:36 PM MT Al****:: made it to R2
6/28/2019 1:56:46 PM MT clb****:: It is a signal that I have been working on for 7 or 8 years. I really need to re-code the whole thing, but haven't had time. I started the project in 2009.
6/28/2019 1:55:11 PM MT bbb****:: CLB what program is that?
6/28/2019 1:53:56 PM MT Al****:: Flash Boys ran it back up to R1
6/28/2019 1:53:21 PM MT clb****:: It looks like somebody wants the second quarter to look better.
6/28/2019 1:52:19 PM MT clb****:: I posted a chart in the CCT section showing the natal harmonic signal that I was looking at. The signal at the bottom of the chart is the natal harmonic.
6/28/2019 1:48:28 PM MT clb****:: There is definitely some volatility here.
6/28/2019 1:47:48 PM MT Al****:: focusing on my 2 week 2hr chart so I don't let little moves shake me out
6/28/2019 1:36:14 PM MT Al****:: this little blip up coud be the little jump in the red -Tide
6/28/2019 1:34:58 PM MT Al****:: OK
6/28/2019 1:32:02 PM MT clb****:: I have a fairly strong natal harmonic in 2 minutes. The last one marked the top today.
6/28/2019 1:30:02 PM MT Al****:: just passed that Mercury/Moon aspect-looks negative
6/28/2019 1:25:14 PM MT clb****:: Thanks, I will check it out.
6/28/2019 1:22:45 PM MT Al****:: it connects your energy field to Mother Earth, increasing the positive energy. Need to add it to my book, Your Electric Life.
6/28/2019 1:21:02 PM MT Al****:: same thing-a sheet lets you do it effortlessly every night, even in winter.
6/28/2019 1:18:12 PM MT clb****:: That sounds interesting. A Chinese doctor told me to take off my shoes every night, and stand in the grass for about 10 minutes before going to bed. He said it improves sleep. I haven't tried it yet, but maybe a similar grounding concept.
6/28/2019 1:16:27 PM MT Al****:: the book "Earthing" explains it all-check it out on Amazon. Basally grounds you to the earth.
6/28/2019 1:12:58 PM MT Al****:: that's important. One cannot trade without a good night's sleep. I've found an "earthing sheet really helps.
6/28/2019 1:10:00 PM MT clb****:: I am holding bear put option spreads that expire next Friday. I don't make as much as trading the underlying, but for overnight trades, I sleep better.
6/28/2019 1:04:08 PM MT Al****:: thanks. Lowered my stop to my entry point, so now have a free trade. Plan on holding it over the weekend because of the pattern on my two week 2 hr chart.
6/28/2019 12:54:37 PM MT clb****:: Great call. It looks like the pivot point was within 1 minute of the Mercury Transit.
6/28/2019 12:52:20 PM MT Al****:: here's the late move
6/28/2019 12:47:52 PM MT clb****:: Sorry, that comment got cut off. I am seeing a three day rising trend line on a 20 minute chart that might break shortly.
6/28/2019 12:45:21 PM MT clb****:: minute outcry chart. It has 5 touches. At some point it will break. Of course, the mutual fund people would like the second quarter to look great.
6/28/2019 12:36:00 PM MT Al****:: gotten quiet, but last hour may be interesting
6/28/2019 12:26:06 PM MT clb****:: It looks like a moon, noon, moon type of day.
6/28/2019 12:21:00 PM MT Al****:: near 3:00 Eastern the Mercury Moon cycle hits a 12th harmonic aspect. Oftern adds energy.
6/28/2019 12:17:51 PM MT Al****:: the EXMAs are all curling down.
6/28/2019 12:09:21 PM MT Al****:: hope you are right, because I'm doing this as a swing trade into next week unless I'm stopped out
6/28/2019 12:04:54 PM MT clb****:: Good job on that call. I am anticipating lower prices next week. Closing out longs today.
6/28/2019 12:01:27 PM MT Al****:: I did sell on that high using the Face OF God pattern. That's what I posted in the CCT Room.
6/28/2019 11:59:14 AM MT Al****:: Imagagine a fireball on the 21st. That is a chaos stgrange attractor/strange repellor. It attracted price up into the solstice
and is now repelling them downward. For mor, tahk the Cash In On Chaos course.
6/28/2019 11:58:21 AM MT clb****:: Thanks, Dr. Larson. I will look at that.
6/28/2019 11:55:05 AM MT Al****:: Here's a homework exercise: set up a two week, 2 hourt bar chart using 24 hour data. Draw an extended line from the high on the 21st touching the high today. Draw another such line from the low on the 4th through the low early on the 26th. Then draw a third ling midway between them.
6/28/2019 11:55:04 AM MT clb****:: It is amazing to see the timing of the high exactly on 6/21. On a daily candle chart there is evening star pattern on 6/21. That gave me some warning that there would be weakness this week.
6/28/2019 11:48:32 AM MT Al****:: 7 days from high on the Summer Solstice; 7 days is basicall 1/4th of a Moon cycle
6/28/2019 11:38:26 AM MT Al****:: Thanks clb - I see your chart in the 24/7 CCT Room, where all Certified Chaos traders can post charts anytime. All CCTs get an email telling them a new chart is available
6/28/2019 11:29:04 AM MT clb****:: I am thinking the same thing. I posted a chart in the 24/7 CCT room.
6/28/2019 11:23:20 AM MT Al****:: from the low late on the 26th, I see seven move; corrective rally may be over
6/28/2019 11:11:07 AM MT Al****:: posted another chart in the CCT Room. Just passed solar noon in the two moon day. May be Moon-Noon-Moon
6/28/2019 10:33:49 AM MT Al****:: I don't know. I'll have to look inot it.
6/28/2019 10:08:49 AM MT abiraz7@yahoo.com****:: Dr. Al please what happened to next week S&P Moontide Grid?
6/28/2019 9:58:38 AM MT Al****:: pretty rubbish day-last day of quarter-lot of fund manager window dressing-only got a small gain on my FOG trade
6/28/2019 9:50:19 AM MT Al****:: thanks GON-you are a good man
6/28/2019 9:25:52 AM MT gon:: I linked it to the previous EUR article.
6/28/2019 9:25:06 AM MT gon:: Good morning, article published https://www.fxstreet.com/analysis/cashing-in-on-brexit-201906281524
6/28/2019 9:13:46 AM MT ska:: xtide2plus I see it taking to upwards@ 1130 am
6/28/2019 8:06:29 AM MT Al****:: last night the Moon conjoined Uranus, forming a top. This morning the earth rotated the Exchange to align with the Moon. That formed the top just after the open. This is a "two Moon Day, with Moon timelines near open and close. These days can be volatile, and go Moon to Moon or Moon-Noon-Moon.
6/28/2019 7:54:46 AM MT Al****:: computers sold R1. Using the FOG chart, I joined them
6/28/2019 7:53:23 AM MT Al****:: I have placed a Face of God chart in the Certified Chaos Trader's Room. That room is open
to graduates of my 4 main courses. See http://moneytide.com -> Courses for details.
eMylar Fractal of Pi overlays help you be patient, since they show you future potential moves.
The best bargain in my courses is to take the Cash In On Chaos and Fractal of Pi courses and
learn to use the FOP overlay. Then take Chaos Trading Made Easy, and finish with Face Of God.
6/28/2019 7:37:20 AM MT RR:: GM all.
6/28/2019 7:18:45 AM MT bbb****:: BEW, a lot of times we have noticed when a tide goes vertical it can bring some volatility. I personally look for these times
6/28/2019 7:02:31 AM MT bew:: Im new to this but I have never seen the tide line go flat, then make a 90 degree turn, flat again, another 90. How often does this happen? what is causing this?
6/28/2019 6:32:18 AM MT Al****:: Good Morning. Welcome to the Chaos Clinic. The written Chaos Clinic is posted on the AUX page.
This site has a lot of charts,
so you may find it useful to have several of them available within your
browser. If you have a tabbed browser, you can open separate charts
in separate tabs by right clicking on any link, and selecting "open in new tab"
from the menu. The main list of site pages is at
http://daytradingforecasts.com/chartlistsec.asp
Recommended pages to watch are SPKISS, MTRainbow, and Chat.
For astro stuff, add SPSunMoonMer, Wheel, and Chaos Clinic.
Chaos clinic comments appear at the bottom of the SPKISS, MTRainbow,
and ChaosClinic pages. Comments in the chat room are announced by a
"duck call" noise. This noise also occurs when the sofware detects a
resonant hex pattern on the Wheel page. Trading tutorials
are on the right side of the ListOfCharts page. One should
read Trading the MoonTide Tutorial and Keep it Simple as a minimum.
9:00 Eastern-System: No comments


[ Live Clinics on Friday on DaytradingForecasts.com ]