
Chaos Clinic Recap
Here are Al's comments
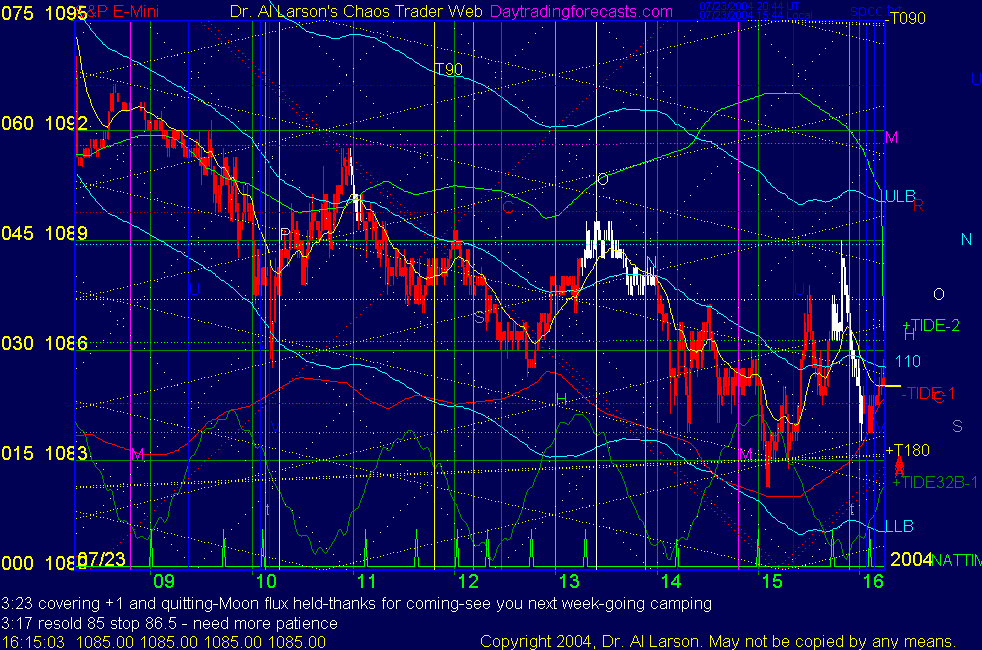
3:23 covering +1 and quitting-Moon flux held-thanks for coming-see you next week-going camping
3:17 resold 85 stop 86.5 - need more patience
3:14 rats-stopped for 0
3:12 notice now that the down move is in a channel in the white harmonic grid
3:05 stop 1085 break even-will just let it ride
3:03 stop 1086
3:02 streak right on the hour timeline -due to the Sun
3:00 stop 1087.5
2:58 my entry was early, but this is really the third trade-holding short
2:53 from the high, have 6 moves-the 7th is coming up-hold short
2:49 note the how the hour lines are marking significant points
2:45 note how 110 EXMA stopped last rally, and now traing only below it
2:40 choppy, but so far so good
2:22 lots of whipsaws-just watch the EXMA's
2:18 when it does that, it generates a "hook and go" signal, in this case a sell
2:16 when a trade between 1:00 and 3:00 fails, reversing on it is usually a good move
2:15 we have had two moves above the 110 EXMA, and could not hold above it-weak pattern
2:10 sold 1085 stop 1088
2:09 looks like inverted to red -Tide
2:02 prices now trading both sides of the 110 EXMA=flat
1:47 it is very important to keep losses small-many trades are losses-so control them
1:43 stopped -1 -failed to thrive -
1:40 still OK but not impressive
1:24 stop 1087.5 -got some help from the Node timeline
1:19 stop 1087-have a good Face of God pattern on the last low
1:17 once it hits 1089-a 3 point quantum, I will move the stop to 1087
1:14 entry stop filled 1088.5 stop 1085.5
1:13 minor low on up white grid line
1:10 coming to the vertical Moon's Node timeline-prices on Node price line
1:07 reistance 1088-putting buy stop 1088.5
1:02 looking ready to rally - watching for break of last minor high
1:00 looking like a good low-should see a 20/110 buy signal soon
12:56 the AUX page shows my rescaled chart. On the Wheel of Fortune, price is squaring time.
12:44 so far a very good fit with the green +Tide if I rescale it
12:36 where the vertical green Sun timeline and this Sun fluxline is a SStrange Attractor/Repellor
12:35 retesting the lows on the sun flux line. I think it will hold
12:22 so far still fitting my Fractal of Pi pattern-suggests a rally
11:55 pretty flat and dull here-as forecast
11:42 coming to the vertical yellow Moon (T) line-where the Exchange squares the Moon
11:15 this lull gives me time to dig out my Fractal of Pi overlays and find the one that fits
today's prices-looks like 5.5 hour size fits
11:10 now MoonTides say the next 2 hours are dull-next trade time 1:00
11:08 once prices got above the 110 EXMA, I watched to see if it would support them
When it did not, I bailed.
11:07 covering +.5 -stalled
11:02 stop 1089-stopped on Mercury price flux-pretty choppy
10:53 stop 1088 - notice the lows on the up dotted white diagonal line-the basic harmonic grid
10:50 since I wound up acutally taking the trade close to the 10:40 Tide turn, I will try to hold to the 11:20 time
10:42 stop 1086.5 -the Moon timeline is the vertical yellow line -usually high energy
10:36 stop 1086 - note rhe spike low on the Timeline cluster-MArket Astrophysics is real
10:33 note the diagonal yellow grid lines-MoonTide Harmonic Grid-lots of energy where they cross
10:24 took that as an out of band buy at 1089 stop 1086
10:12 getting close to green +Tide low -should try to rally a bit
10:03 vertical drop on vertical timeline cluster - hit lower band -no good way to get in on first trade
9:53 drifting lower-too far from 110 to sell-too close to lower Larson band
9:46 in a steady down drift - both 20 and 110 EXMa are parallel-no signal yet
9:30 opening down a bit and quiet on the Mercury electric field flux line
9:00 Good morning from Chaos Manor
Besides the comments made by Al, the chat room is has live
comments from other traders who sometimes share their views,
trades and tips. Below are the chat room comments from this clinic
7/23/2004 11:58:00 AM Mountain Al:: the real trick is that all my dat files had the chunk between 6-14 and 7-22 removed. Had to bebuild them all from the backup copies-
7/23/2004 11:56:36 AM Mountain Al:: mm-yes I had a technocrap problem last night-sorry to hear the technocrap bug hit your machine-I now run 3 drives in every computer main,mirror,1 day backup, and then backup over network to a master drive
7/23/2004 11:51:22 AM Mountain mm:: Upon further study: you have 2 dates on this chart: one is correctly 7-22-04, but there is also 6-14-04. Your computer is playing tricks, I suspect.
7/23/2004 8:27:41 AM Mountain mm:: Al, having been on vaccasion and also having blown the hard drive on my computer, I'm trying to get back up and running. I'm looking at your SP1Day chart for the first time in a few weeks and the figures you use for Thursday's O, H, L and C seem to be about 25 pts too high. The WSJ figures are sometimes a couple of pts. off max, but this is funny.
9:00 Eastern-System: No comments


[ Live Clinics on Friday on DaytradingForecasts.com ]