![]()
![]()
**************************************************************************************
The CPI Rocket And The Energy Field
Chaos Clinic for 8/12/2022
***************************************************************************************
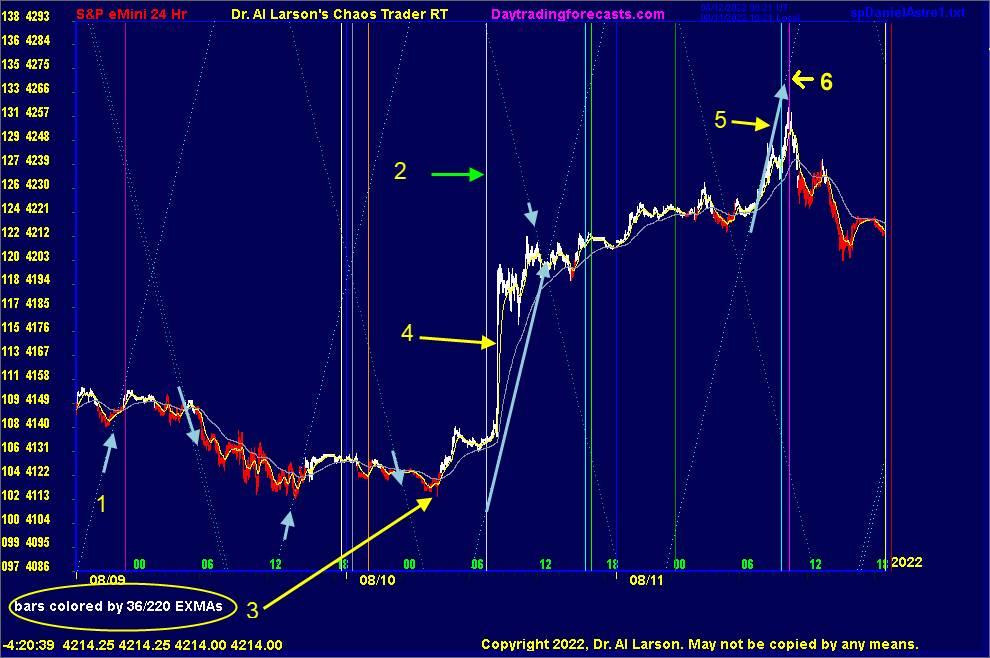
Many were surprised by Wednesday's S&P rocket rally upon the release of the Consumer Price Index.
I was not, because the underlying electric energy field suggested the probability. This
chart shows the key features of the energy field involved. The features are numbered to aid in description.
Feature 1 is a series of up and down arrows on the flux lines of an astro cycle that laces through
the S&P. It acts like a crosswind that can push prices up or down. Sometimes it can "catch" and
power a big move. On 8/10 it was in position to do so.
Feature 2 is one of the vertical lines shown on the Secret charts on daytradingforecasts.com.
This particular line has a high correlation with powerful up moves.
Feature 3 is a simple pair of EXMAs, a 36 minute and a 220 minute. These are used to color the bars
on the chart. It is a useful tool for tracking moves. On 8/10, it signaled an up move hours before
the release of the CPI report.
Feature 4 is the vertical move upon release of the CPI data, which showed the annual rate of inflation
had fallen from 9.1 to 8.5 percent. Logically, that's still a high rate, but the Flash Boy computers
do not apply logic, they just follow the bid and ask, which tend to follow the electric energy field.
Feature 5 shows the follow through morning rally on 8/11. It drew energy from the astro cycle of feature 1.
The rally turned down at feature 6, the magenta vertical line from the Secret charts at daytrading forecasts.
It's always in the energy field first.
For more on my work and to subscribe to Tomorrow's Market Email Hotline and access to daytradingforecasts.com see
Moneytide.com
Software to plot electric field flux lines in NinjaTrader is available at
energyfieldtrading.com
8/12/2022 1:16:35 PM MT Al****:: OK, I'm done - made a nice gain today so I thank the Creator
thanks for coming- see you next week -take some courses
8/12/2022 1:04:59 PM MT Al****:: about to hit R3 - that's my cover point
8/12/2022 12:35:46 PM MT Al****:: got juice from Mercury time line
8/12/2022 12:31:43 PM MT Al****:: broke above yesterday's high
8/12/2022 12:15:18 PM MT Al****:: EXMAs steady up
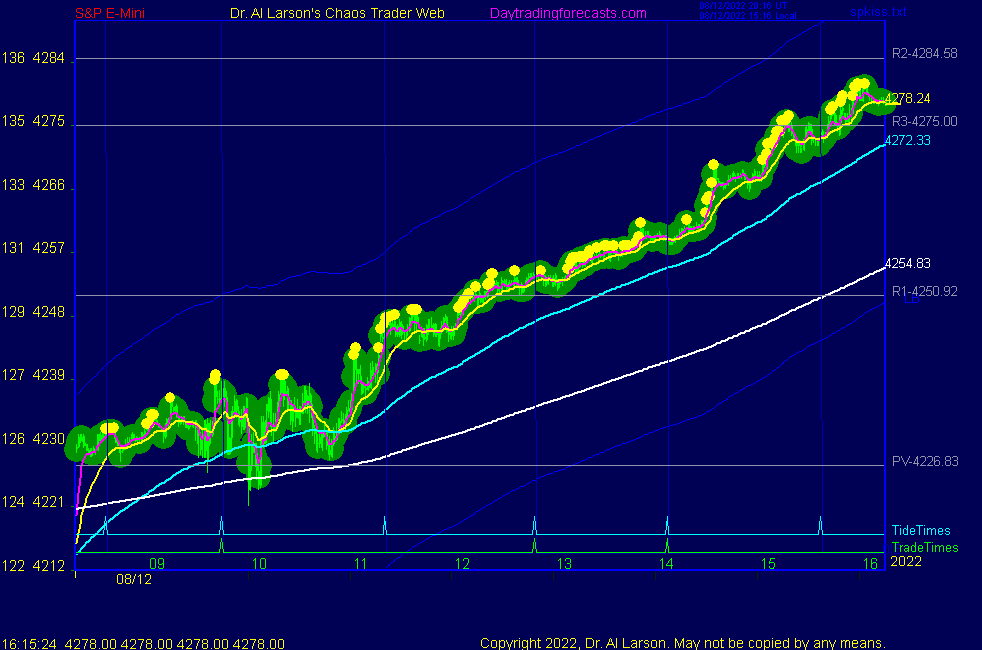
8/12/2022 12:02:51 PM MT Al****:: many days run 4 levels on Secret->esnat72 - 15 more points is that 4275 R3
8/12/2022 11:58:10 AM MT Al****:: there is the second green level on Secret->esnat72
8/12/2022 11:54:57 AM MT Al****:: testing yesterday's high -I expect it to break through
8/12/2022 11:52:26 AM MT Al****:: move accelerating now
8/12/2022 11:49:31 AM MT Al****:: looks like it did
8/12/2022 11:38:52 AM MT Al****:: watching to see if Moon T180 time line adds energy
8/12/2022 11:16:53 AM MT Al****:: added energy as exchange rotated past the Sun
8/12/2022 10:48:45 AM MT Al****:: EXMAs make good stop guides - I use the one longer than the one supporting or resisting prices
today the 54 minute is supporting prices so I'm using the 110 as my stop
8/12/2022 10:26:29 AM MT Al****:: EXMAs have an interesting property - they have a limit to how fast they can move3
at that limit they become straight lines
right now the 110 is a straight line
extending it to the close gives 4275
8/12/2022 10:08:19 AM MT Al****:: in addition to the EXMAs shown on SPKISS chart 3, I also use a
54 minute ( 18 3 minute bars)
good moves stay one side of it -this is a good move
8/12/2022 9:42:28 AM MT Al****:: looking at higher targets I see R3 4275 - on the Secret->Daniel chart that is a magenta starburst level
8/12/2022 9:28:22 AM MT Al****:: on the Secret->esnat72 chart base was on green vibration - very likely to reach next green
8/12/2022 9:24:05 AM MT Al****:: this move is getting some lift from a green swan - see Chaos Clinic chart
8/12/2022 9:18:42 AM MT Al****:: note on various charts the 36/220 is white=up
8/12/2022 9:17:35 AM MT Al****:: the Flash Boys bought the pivot 4226.83 - so R1 4250.92 is first target
8/12/2022 9:07:47 AM MT Al****:: SPKISS page chart 3 shows EXMA rainbow up
8/12/2022 8:59:06 AM MT Al****:: slow day -often happens on Full Moon
may get some energy near 13:00 - 13:30 Sun and Moon time lines
8/12/2022 6:57:42 AM MT Al****:: Good Morning visitors. Welcome to the Chaos Clinic.
The written Chaos Clinic is on the AUX page.
This site has a lot of charts,
so you may find it useful to have several of them available within your
browser. If you have a tabbed browser, you can open separate charts
in separate tabs by right clicking on any link, and selecting "open in new tab"
from the menu. The main list of site pages is at
http://daytradingforecasts.com/chartlistsec.asp
Recommended pages to watch are SPKISS, MTRainbow, and Chat.
For astro stuff, add SPSunMoon, Wheel, and Chaos Clinic.
A special set of Dr. Al's research charts are on the Secret page.
Comments in the chat room are announced by a
"duck call" noise. This noise also occurs when the software detects a
resonant hex pattern on the Wheel page. MoonTide trading tutorials
are on the right side of the ListOfCharts page. One should
read Trading the MoonTide Tutorial and Keep it Simple as a minimum.
Many subscribers do not strictly trade the MoonTides, but use the charts on this
site as input to their own trading strategies. For example, charts 5 and 6 on the
SPKiss page are a good starting point for swing traders.
Also on this site is the Certified Chaos Trader's Room. That room is open
to graduates of my 4 main courses. See http://moneytide.com -> Courses for details.
9:00 Eastern-System: No comments
![]()
![]()