
Chaos Clinic Recap
Here are Al's comments
12:43 -This market is not doing anything, so I'm done for the day-No clinic next week_see you in 2 weeks-take a course-Have a great weekend
11:10 next trade time is near 13:15 -taking a break until get close to that time
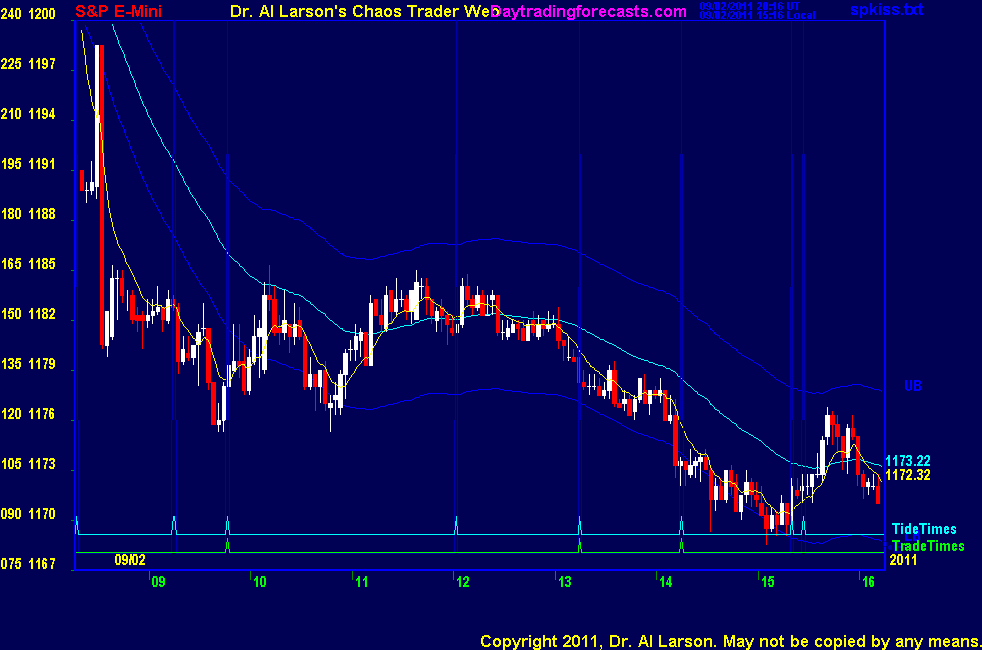
10:55 low held - came on a Natural Time point - see SP1Day chart ; tutorial on Natural Times, right side of ListOfCharts page
10:47 testing low
10:39 we got the early jobs report volatility I expected; now looks like we are getting the long weekend dullness
10:32 passing on the first trade
10:29 looks like the volatility may be over
10:27 now holding up, so no continuation sell here
10:22 updated my FOP chart in the CCT room
10:14 110 EXMA acted like a tounge depressor ( gag) -range from low 10 points-Fractal of Pi says trade in this range and maybe retest low
10:07 low still holding-rally up to the 110 EXMA
9:54 got a low almost on the Tide Time - 110 EXMA is near 1185, starting to curl upward; trading on the Jupiter +J090 electric field flux
9:42 the Chaos Trading Made Easy course has a targeting technique that yesterday gave a target of about 1176
9:38 this week's highs were set by Mars square Saturn, flux near 1227. They provide support near 1173
9:28 the 110 EXMA is near 1189 - prices are too far from it for a good hotline trade setup
9:27 I have placed a Fractal of Pi chart in the Certified Chaos Trader's Room. That room is open
to graduates of my 4 main courses. See http://moneytide.com -> Courses for details.
9:21 trade times today are 09:47, 13:15, and 14:15 . The first one may not give a good setup under these conditions
9:13 just had a hex pattern recognized by my software-see Hex Wheels today and tutorial on Hex Wheels linked on right side
of ListOfCharts page - this one has corners set by Jupiter, Moon, and Sun/Venus and X, the Exchange
9:07 down sharply on jobs report-most of deline may have already taken place
9:00 Good morning from Chaos Manor
Besides the comments made by Al, the chat room is has live
comments from other traders who sometimes share their views,
trades and tips. Below are the chat room comments from this clinic
9/2/2011 1:43:59 PM MT BBB:: Just beofre That second trade time was a good setup in my opinion to the short side - or am I just seeing something I should not be seeing?
9/2/2011 11:13:25 AM MT kwb:: thanks Al......
9/2/2011 9:59:43 AM MT Al****:: I looked at Wilder's scheme years ago, and in fact I cracked it - I found the claim of no inversions untrue - and when I worked his problem diligently, on the S&P daily turns I got 14 points where he got 10.
9/2/2011 9:12:30 AM MT kwb:: I used to get daily emails from an S&P trader who used to give potential times and movements for the S&P...Having studied multiple trading ideas, realized that he seemed to be using a system that Welles Wilder talked about with trading with the earth movements (rotation) as his charts were the same every 4 days, with a possible change in direction every 4 days between either the 8-1 point or 1-2 point....because you offer 2 directional trading (red or green) and seem to show similar charts from time to time, have you noticed if there is a more likely time during your periods when these trend changes ( from red to green) occur?
9/2/2011 9:06:19 AM MT Al****:: kwb-Natural times are similar on all days - they are a fine grain structure most useful on dull days-be sure to read the tutorial on them
9/2/2011 9:03:03 AM MT kwb:: Hi All,
you mention the "Natural Times" chart in "SP1" and see where you have a green "heartbeat" line at the bottom (also at the bottom of your Chaos chart....are those the "Natural Times" for trend changes...if so, are their combinations of when 2-3-4 of these occur on certain days than others?...
9/2/2011 7:55:51 AM MT BBB:: Morning to all, good luck and have a great weekend.
9/2/2011 7:52:33 AM MT Al****:: GM all-TG, I think you are seeing the effect of the super high speed computers used by hedge funds to trade these reports.
They react in milliseconds to order flow
9/2/2011 7:39:23 AM MT TG****:: Al, I think you mentioned in a recent clinic that in some stretches of time you need to look at a 24 hr chart to see what's really going on. Well, this seems to still be within one of those stretches. The rainbow chart set to 24hrs and the 24hr 20/110/55 exma chart have been working very well for US morning trades.
9/2/2011 7:33:17 AM MT TG****:: mm, I had a 2-3 month layoff from trading, preparing for the relocation. I missed a lot of good volatility, hopefully it lasts a bit longer. Only started trading again this past week but still managed a +28 pts for the tail end of August.
9/2/2011 7:15:38 AM MT mm****:: TG - I wondered about that also - the 8:29 candle closed at its H of 98.50 and the 8:30 candle starts at 92:50 - in theory this is possible - but what a fluke !
9/2/2011 6:35:20 AM MT TG****:: my esignal 1 minute chart shows a 6 point gap between a closing candle and the next opening candle near the 8:30 employment #. Is that correct?
9/2/2011 6:33:47 AM MT TG****:: Hello from Singapore.
9/2/2011 4:49:59 AM MT mm****:: gm all - have a great day
9:00 Eastern-System: No comments


[ Live Clinics on Friday on DaytradingForecasts.com ]